What Is A Trend Line and How To Draw One?
Today we’ll answer the question of what a trend line is and how to draw one the right way. We’ll also tell you what trend lines are really good for.
What is a trend line?
A trend line is a straight line that connects two or more price points on a chart.
What are trend lines good for?
Trend lines are used to identify the direction of a market, as well as support and resistance levels.
When the market is in an uptrend, the trend line is drawn below the price action to connect the lows.
This line is called a support trend line.
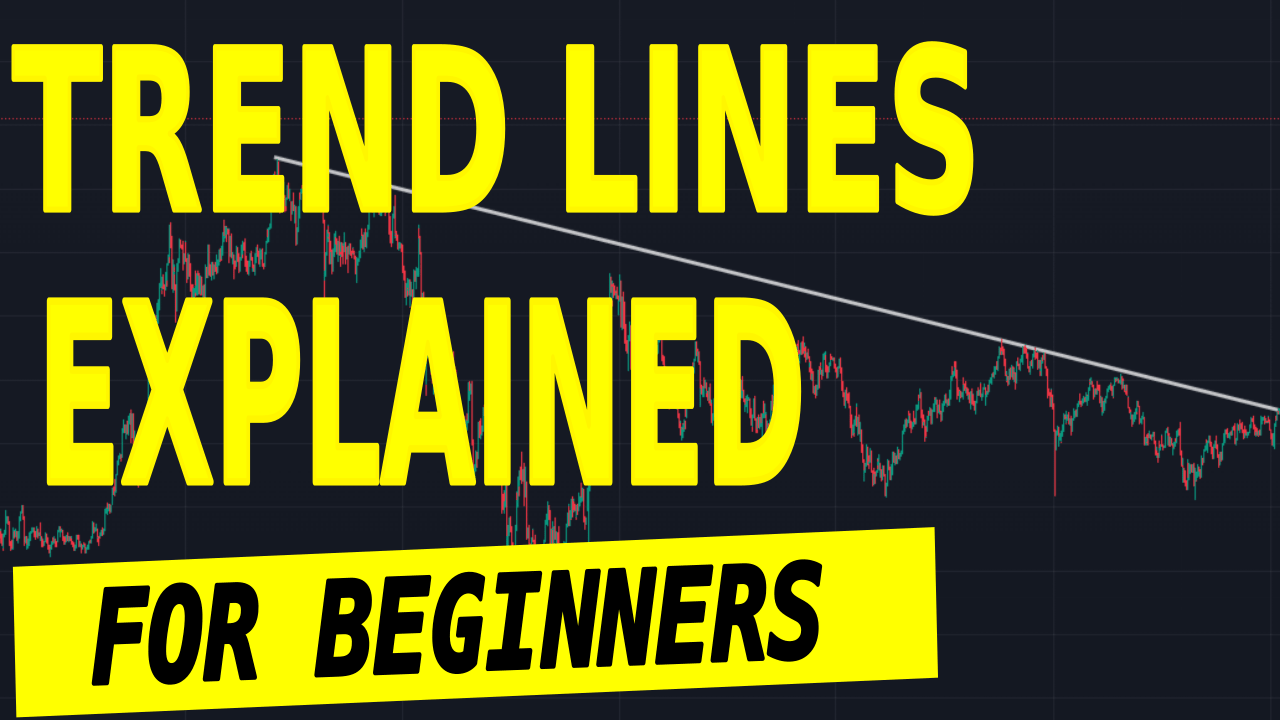
In a downtrend, the trend line is drawn above the price action to connect the highs.
This line is called a resistance trend line.
The angle of the trend line is an important factor in determining the strength of the trend.
A steeper trend line indicates a stronger trend, while a shallower trend line indicates a weaker trend.
If the market is trading sideways, the trend line will be horizontal.
This line is called a horizontal support or resistance line.
Can trend lines be used on all time frames?
Yes, Trend lines can be used in all time frames, from intra-day charts to weekly and monthly charts.
They can also be used on different types of charts, such as bar charts, candlestick charts, and point and figure charts.
Once a trend line is drawn, it can be used to identify entry and exit points.
For example, if the market is in an uptrend, you would look for buying opportunities when the price action touches the trend line and selling opportunities when the price action breaks below the trend line.
In a downtrend, you would look for selling opportunities when the price action touches the trend line and buying opportunities when the price action breaks above the trend line.

