
The 10 Most Important Trading Chart Patterns for Beginners
There are three main groups of chart patterns: continuation, reversal, and bilateral.
When identifying patterns, it is important to look at the overall trend of the price first. This will help you to identify which direction the pattern is likely to continue in.
It is also important to look at the volume of trading to see if there is enough interest to sustain the move. If there is low volume, the pattern is less likely to continue.
Finally, you should also consider the time frame you are looking at. Some patterns take longer to develop than others, so you need to make sure you are looking at the right time frame in order to identify the pattern.
Continuation Chart Patterns
Continuation patterns occur when the price is continuing in the same direction as the trend.
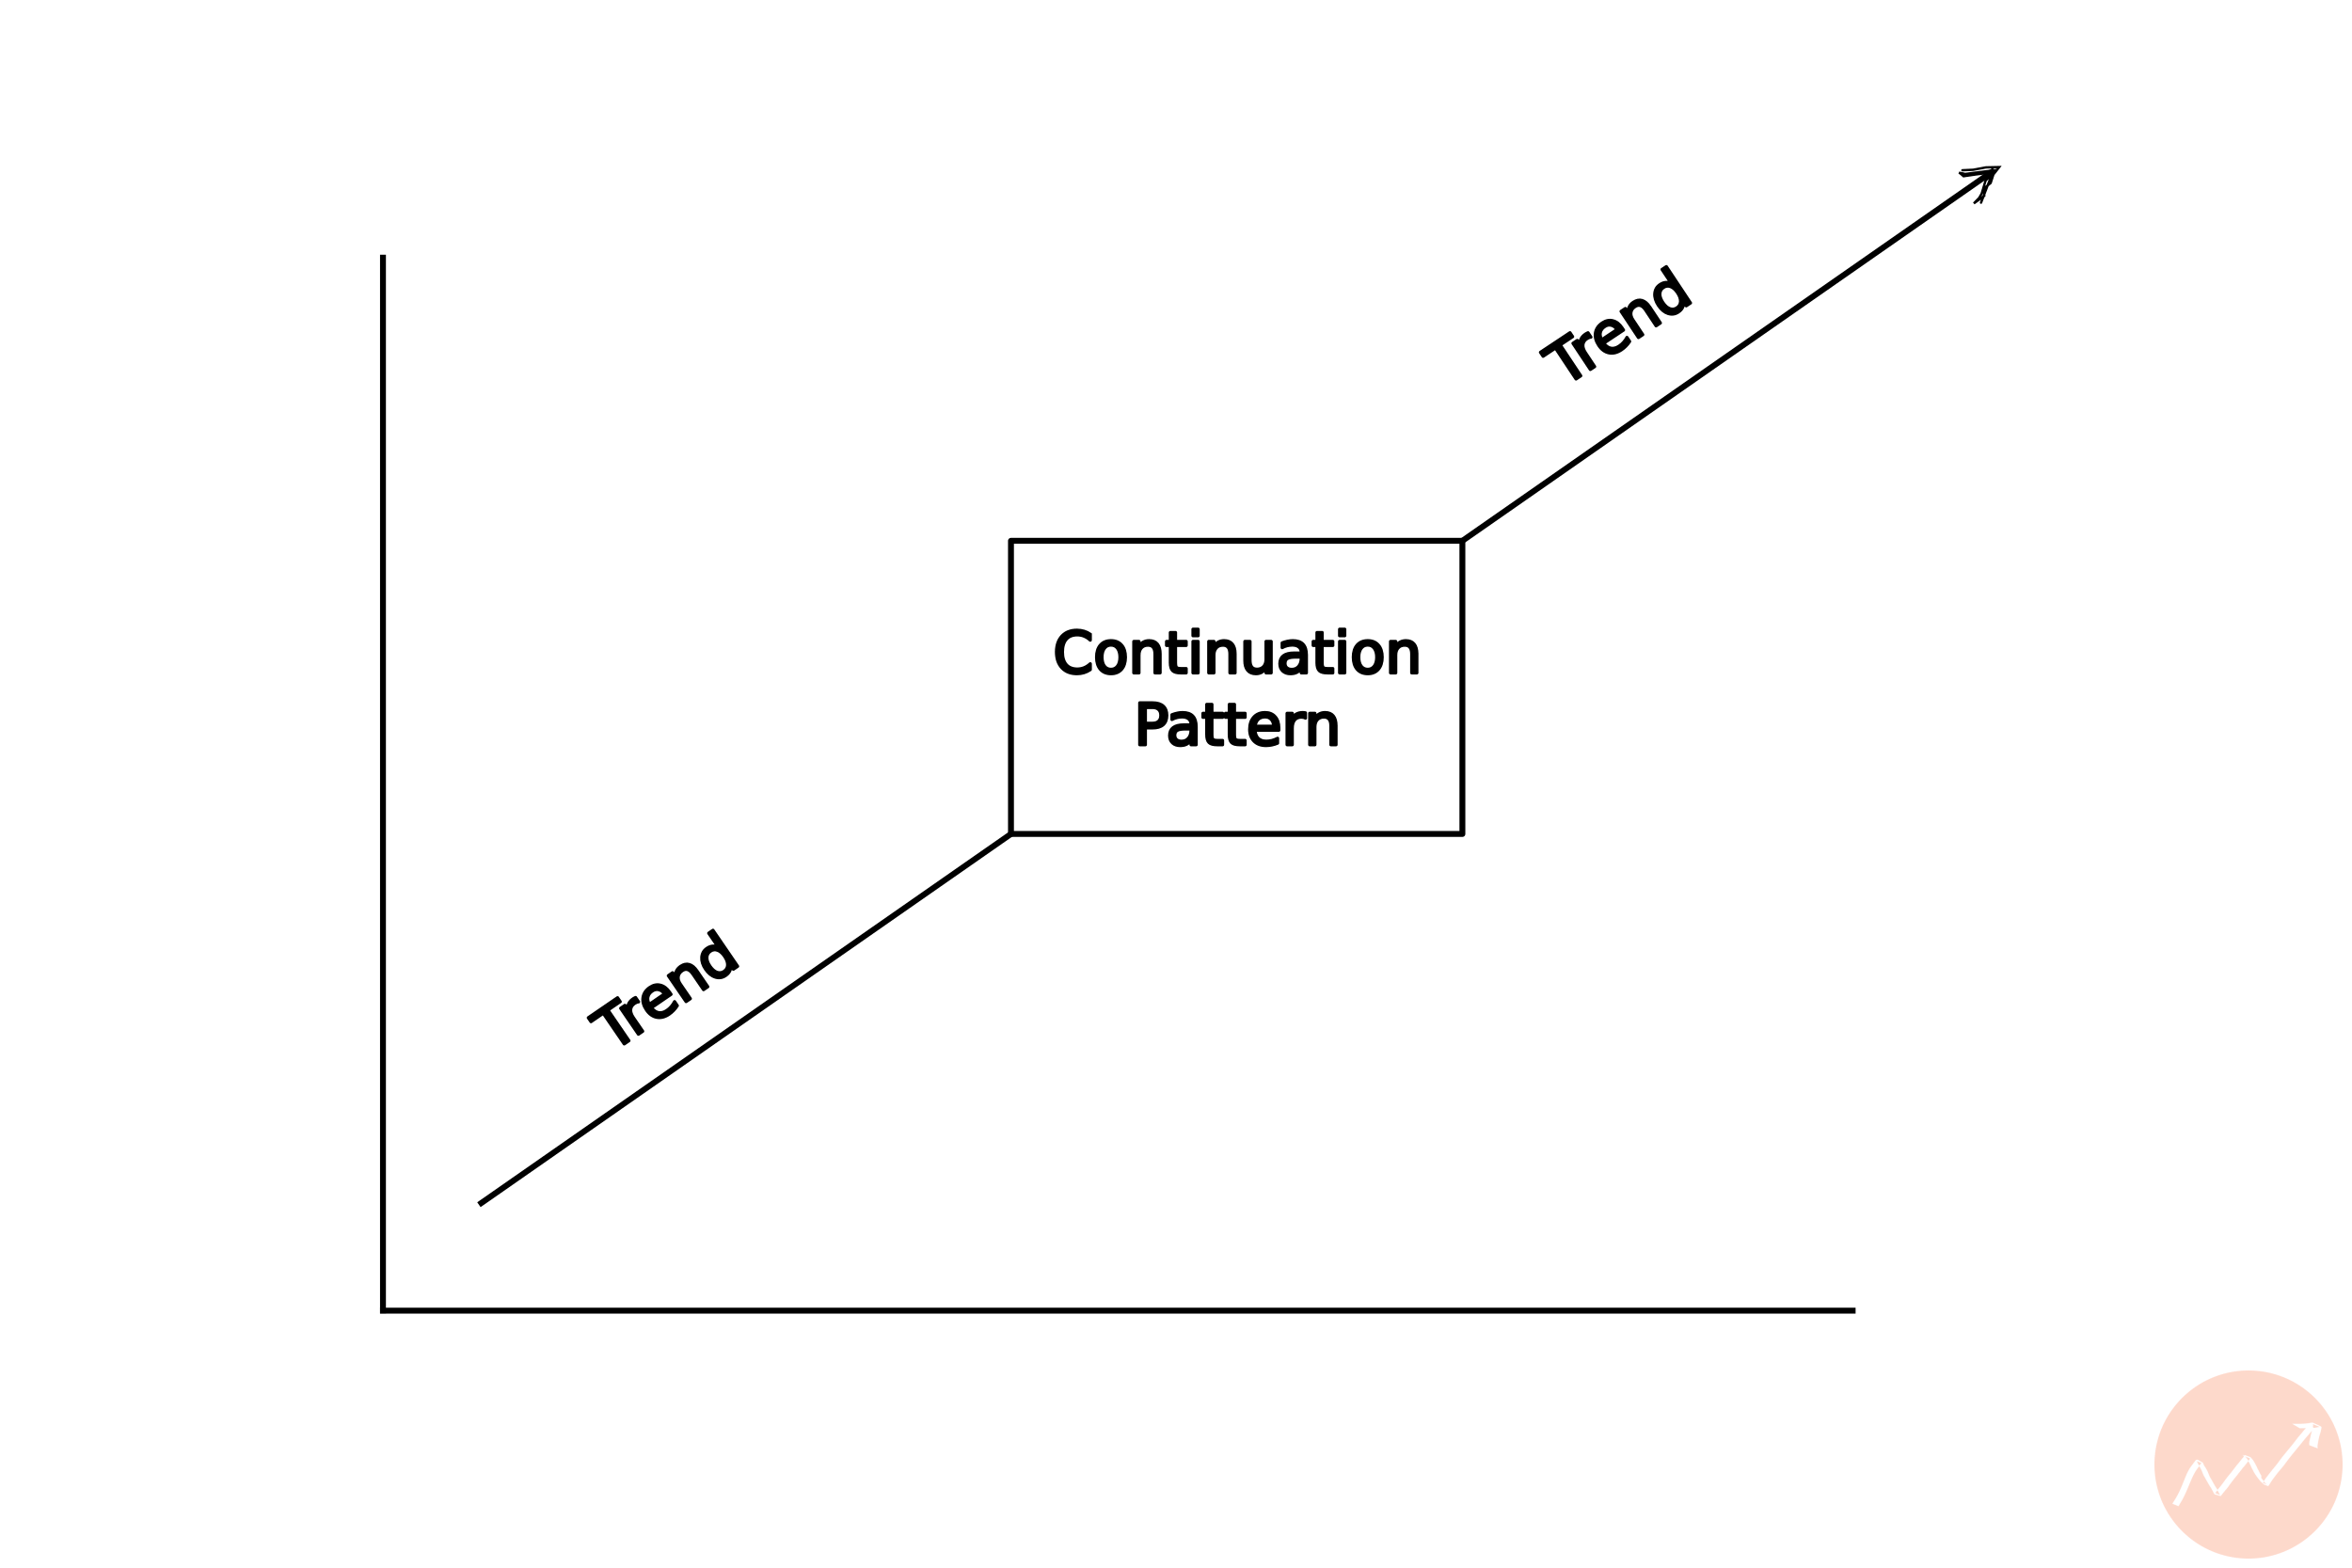
Here are some examples of continuation chart patterns:
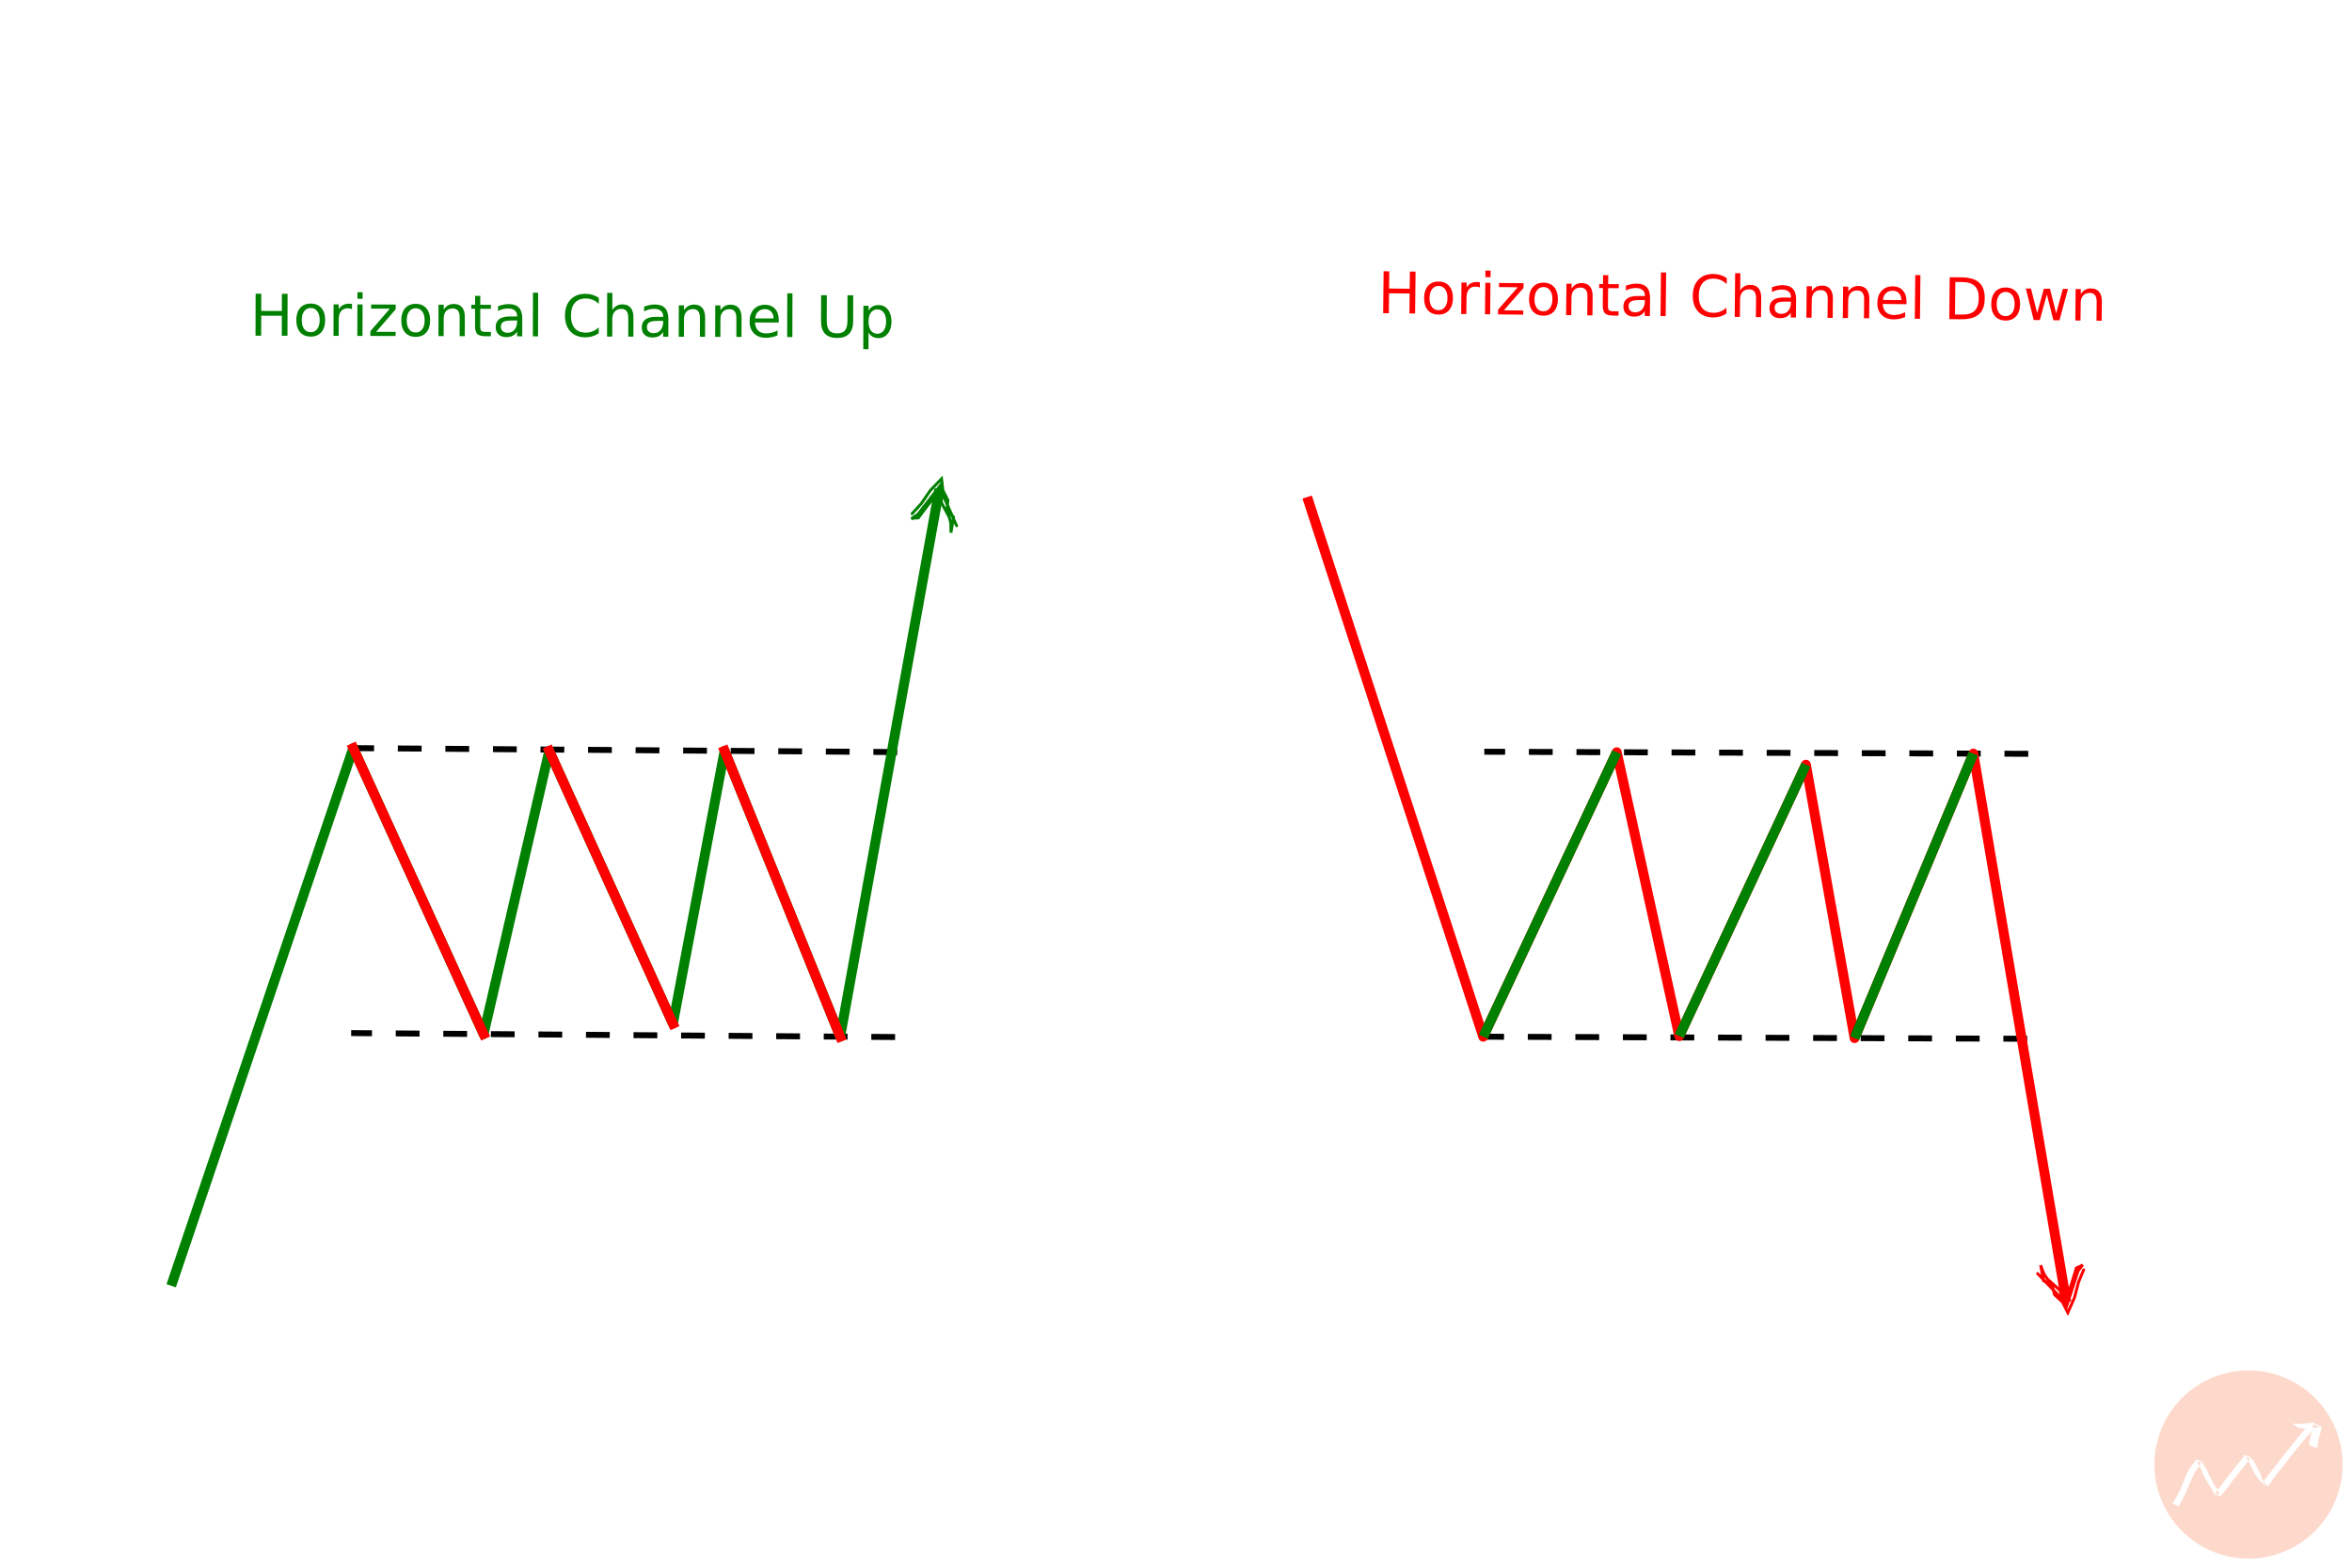
Horizontal Channels
A Horizontal Channel is a continuation chart pattern that consists of two parallel trend lines which form support and resistance levels.
This pattern is used to identify potential entry and exit points for traders. It can be used in both long and short-term trading strategies.
The Horizontal Channel is formed when the price of an asset moves between two parallel trend lines, creating a channel where the price action bounces back and forth.
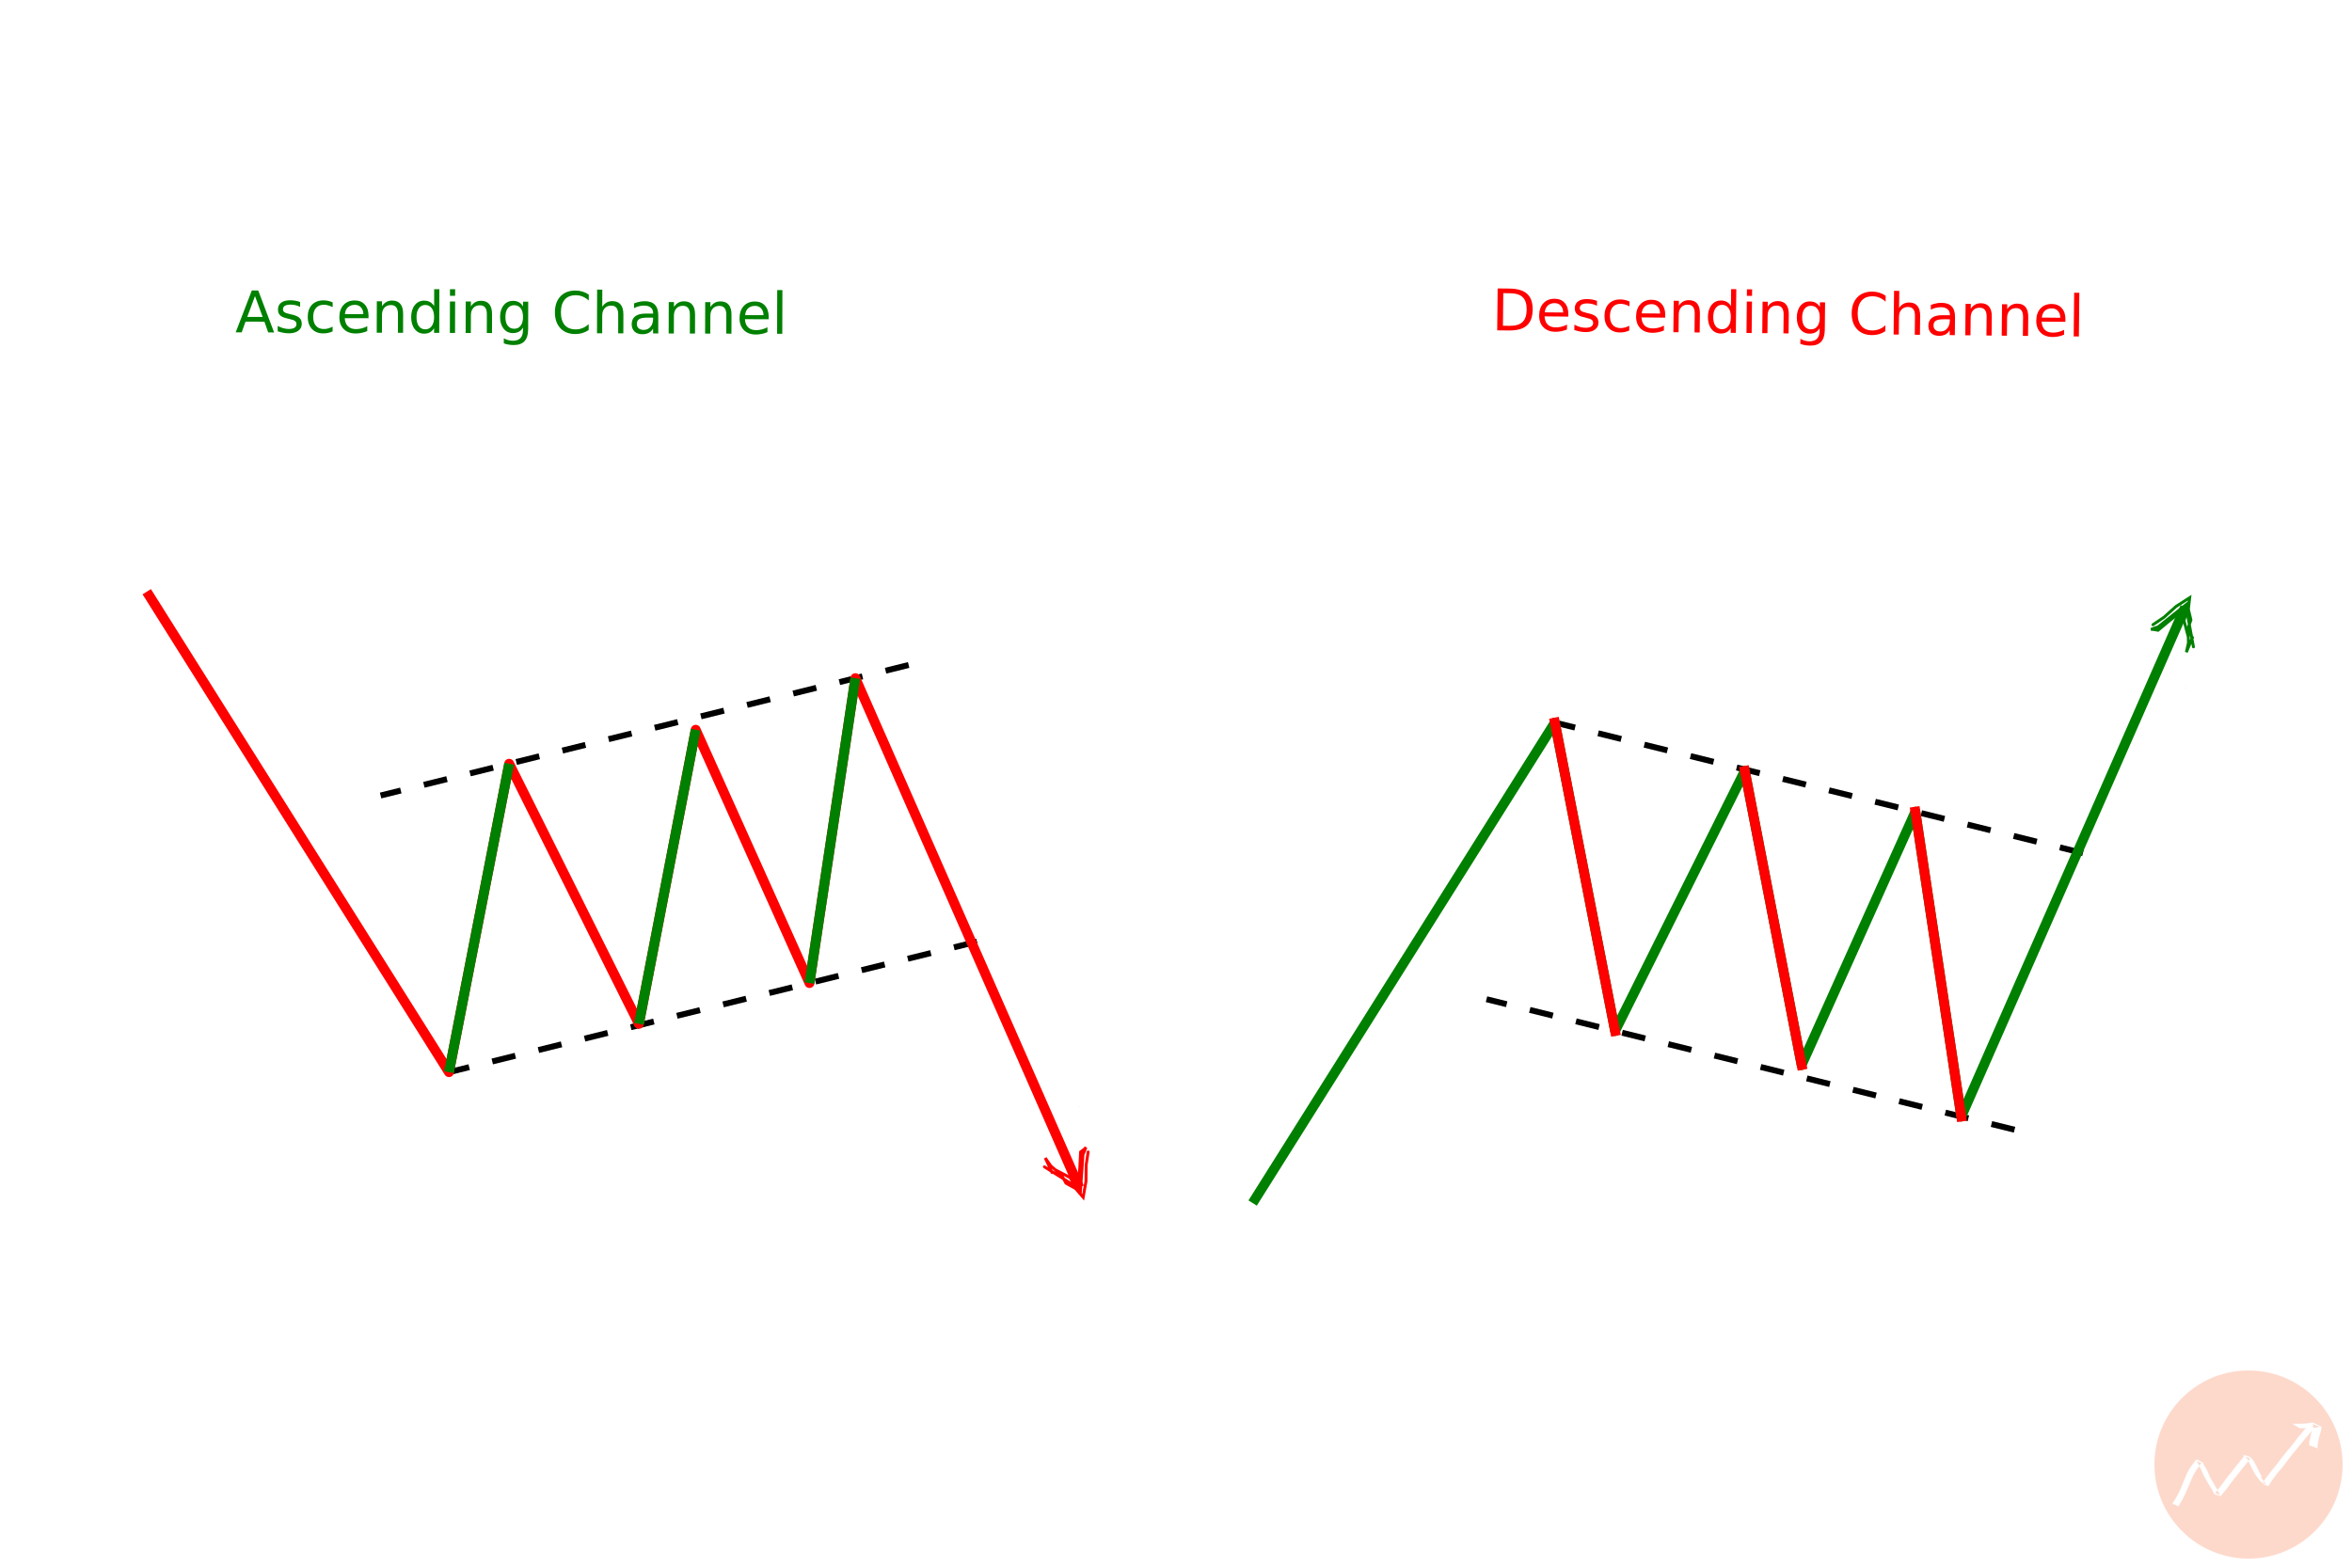
Ascending Channel and Descending Channel
The Ascending and Descending Channels are two of the most popular chart patterns used by technical analysts.
These patterns are characterized by an upper and lower trend line that form a channel.
The Ascending Channel is formed when the price of an asset makes higher highs and higher lows, while the Descending Channel is formed when the price makes lower highs and lower lows.
Both patterns provide traders with important information about potential support and resistance levels, as well as possible entry points for trading.
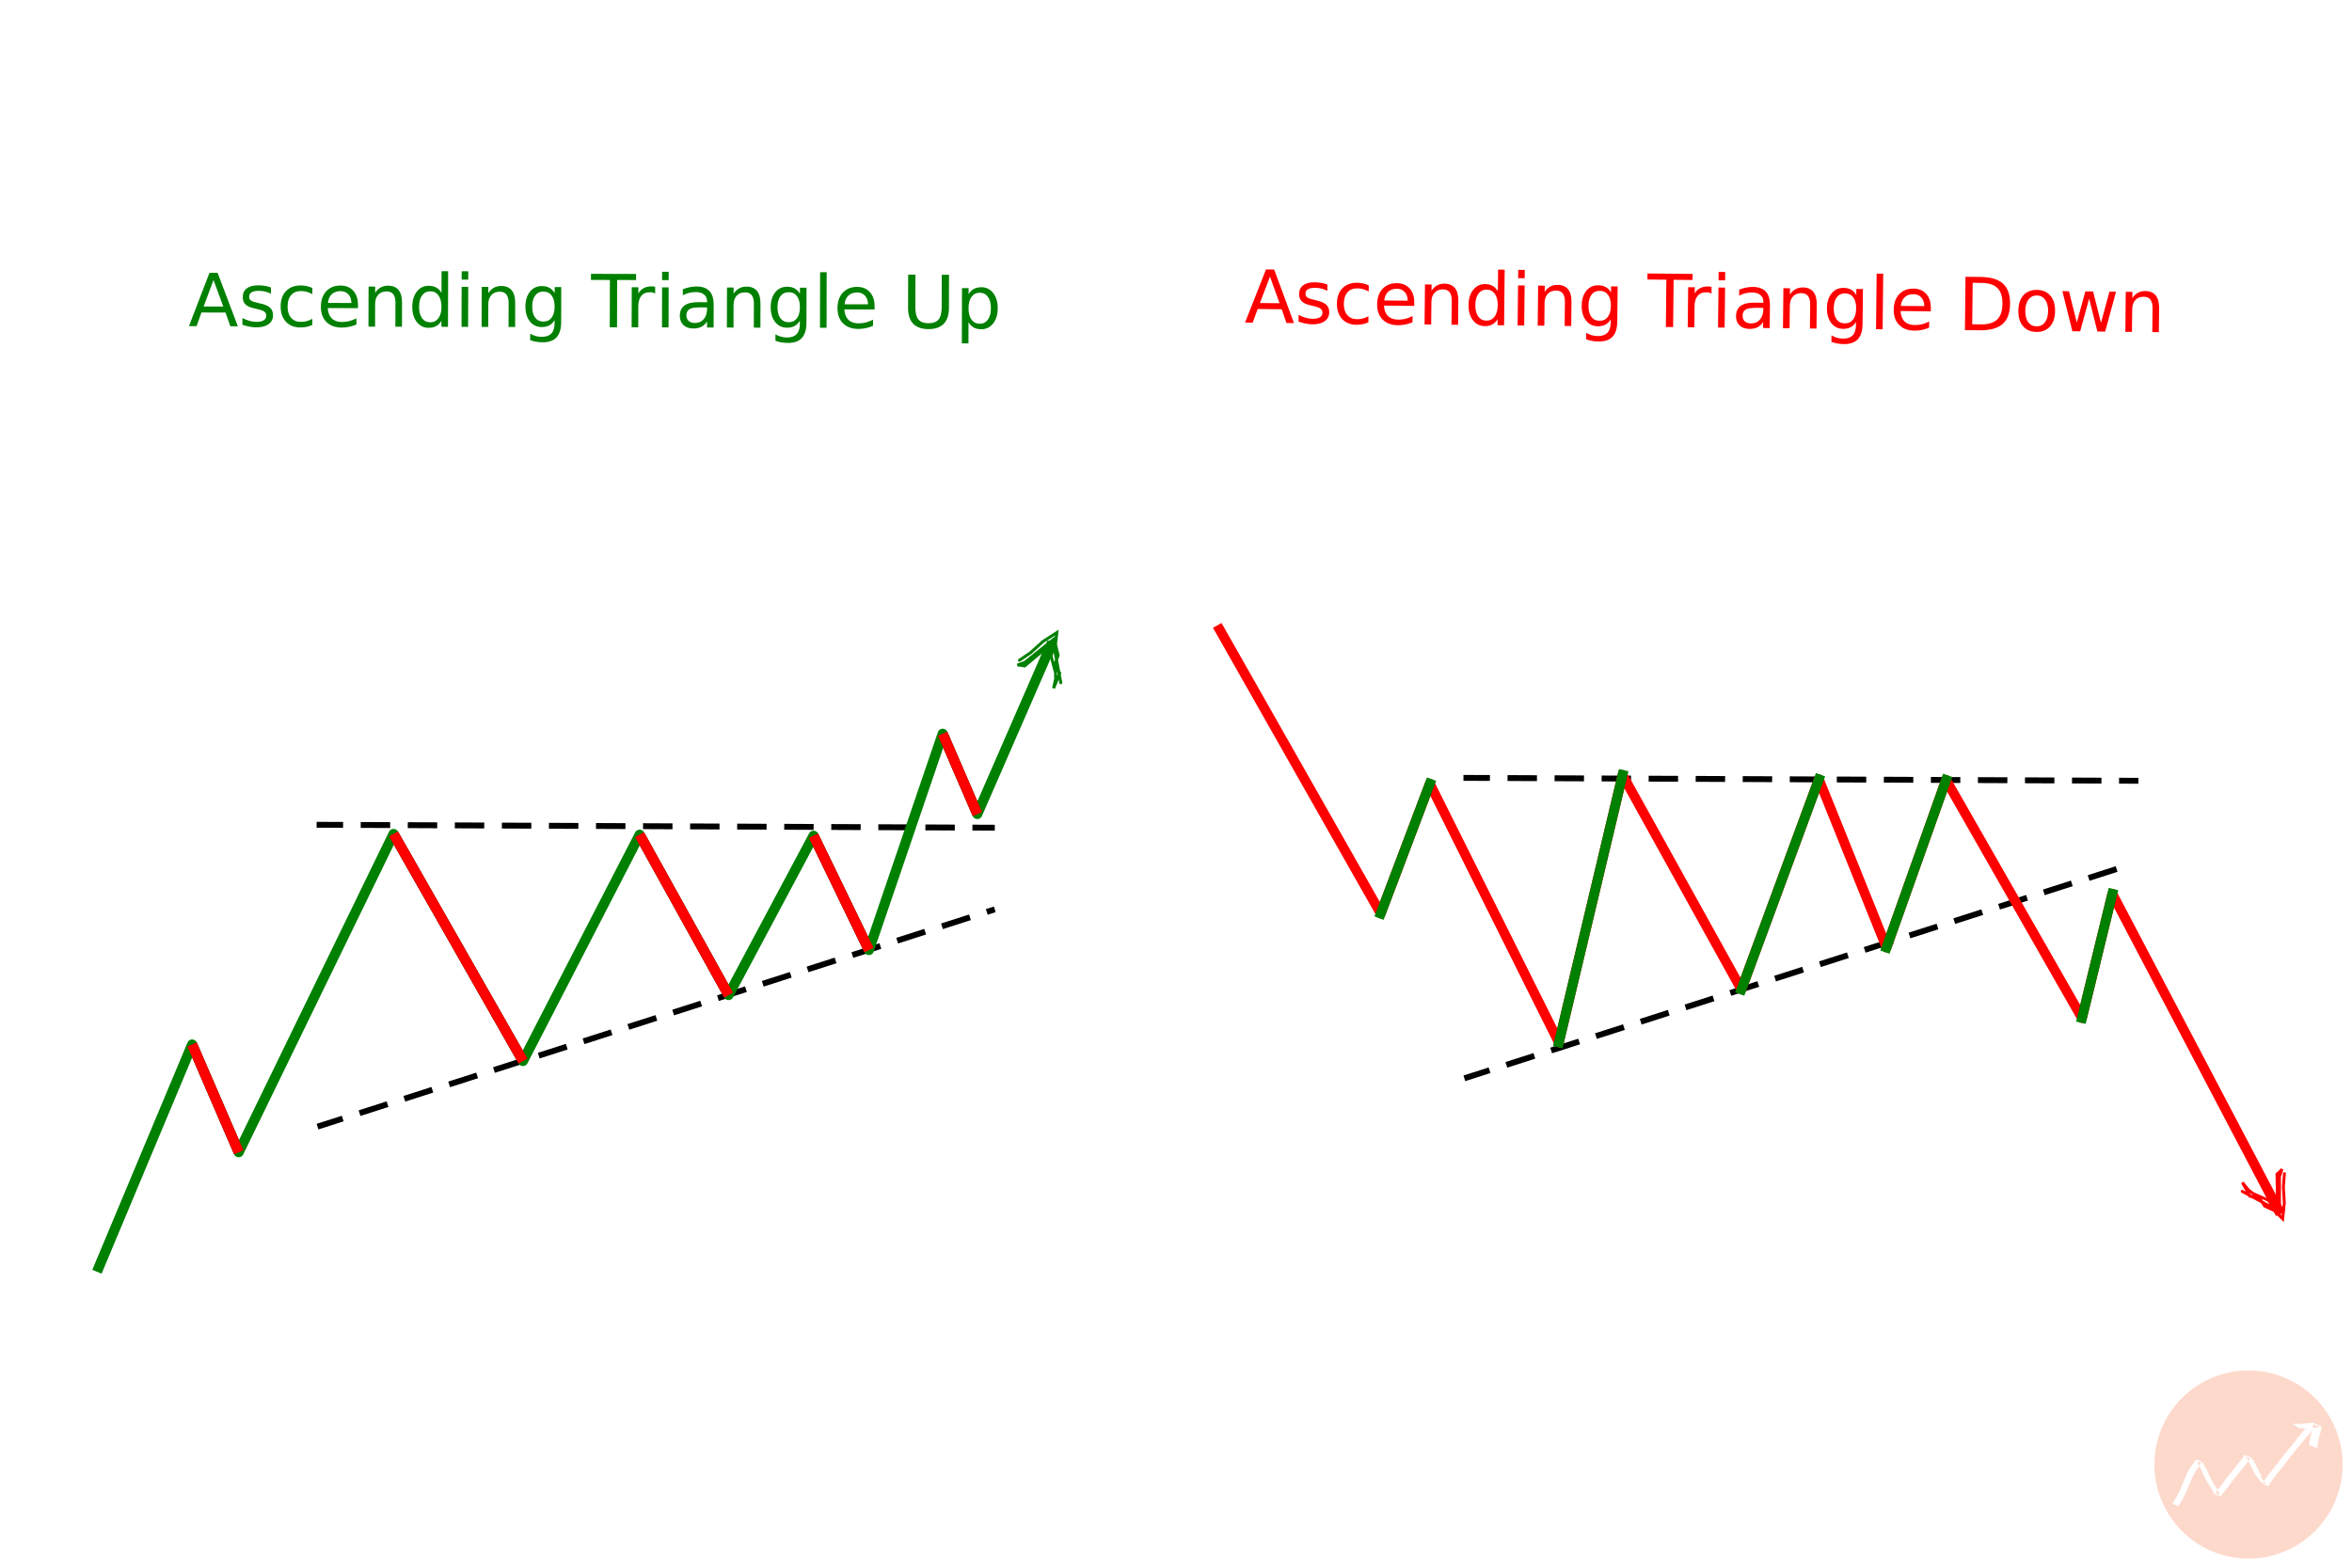
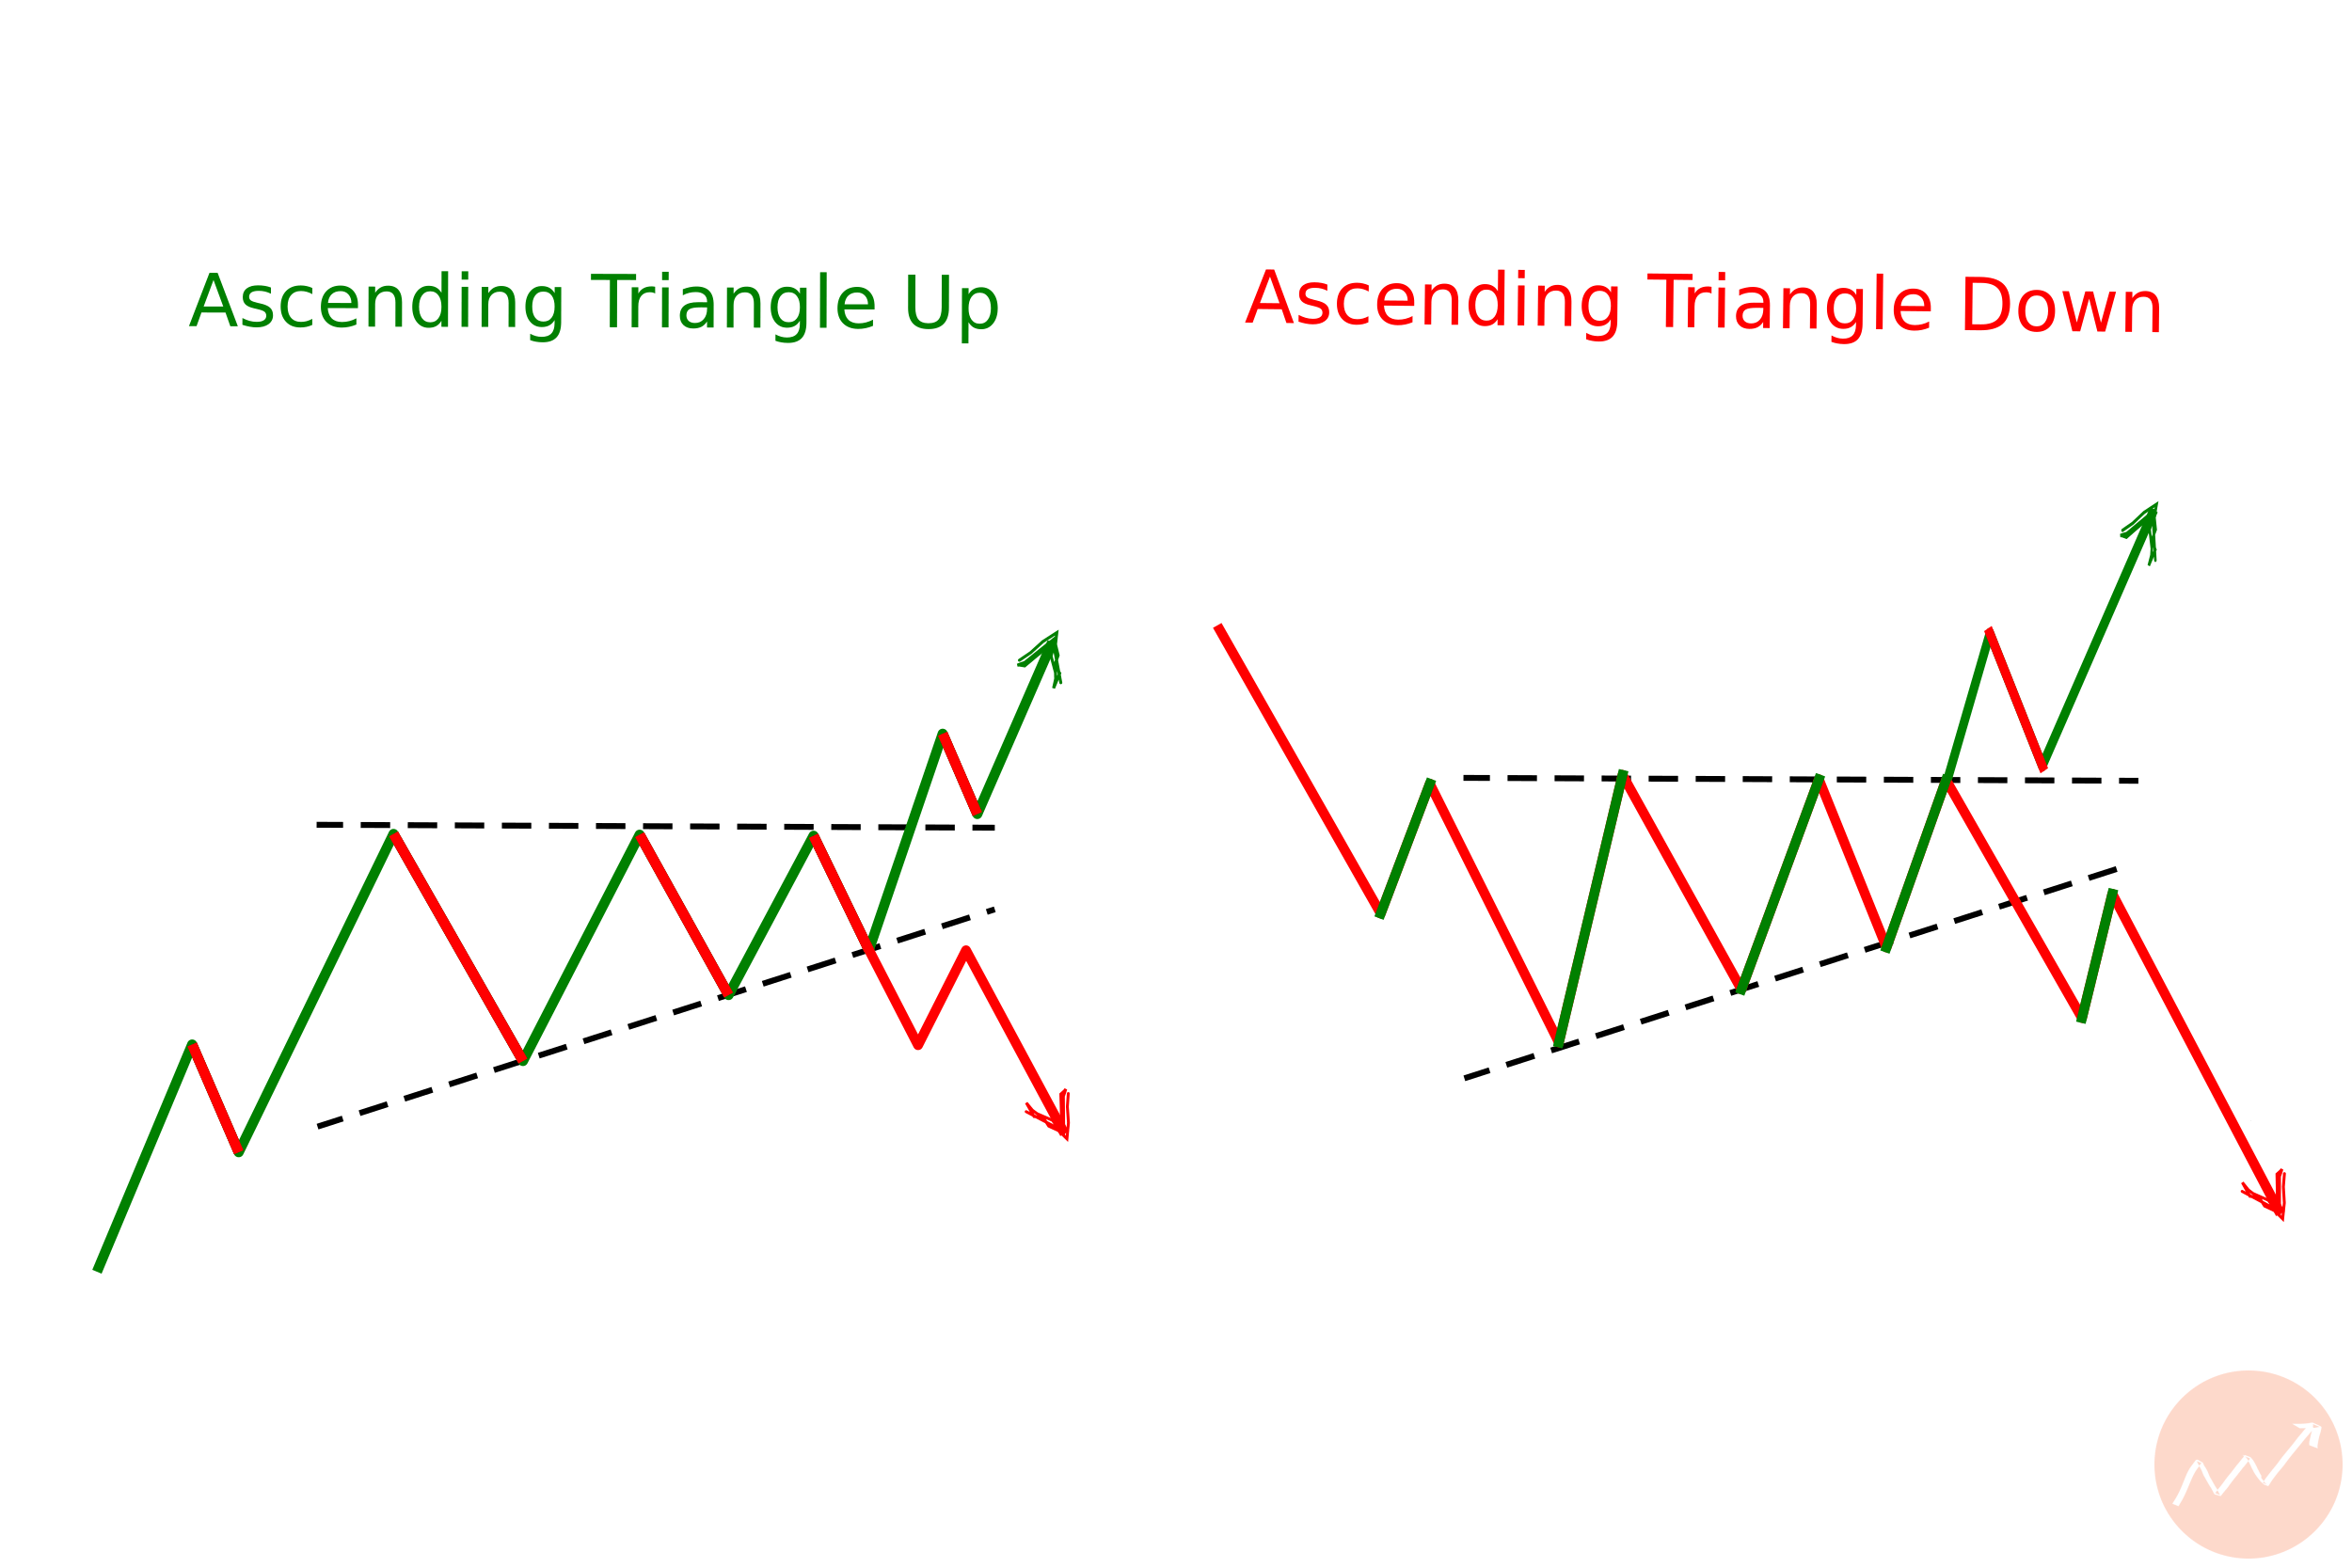
Ascending Triangles in an Up and Down Trend
Ascending triangle chart patterns indicate that the underlying asset is likely to break out of the established range and keep the current trend intact.
The ascending triangle indicates a pattern of higher lows, which suggests that buyers are willing to pay increasingly higher prices to acquire the asset, despite the fact that the price doesn’t reach any new highs.
This suggests that the current trend is likely to continue, and that a breakout is likely to occur.
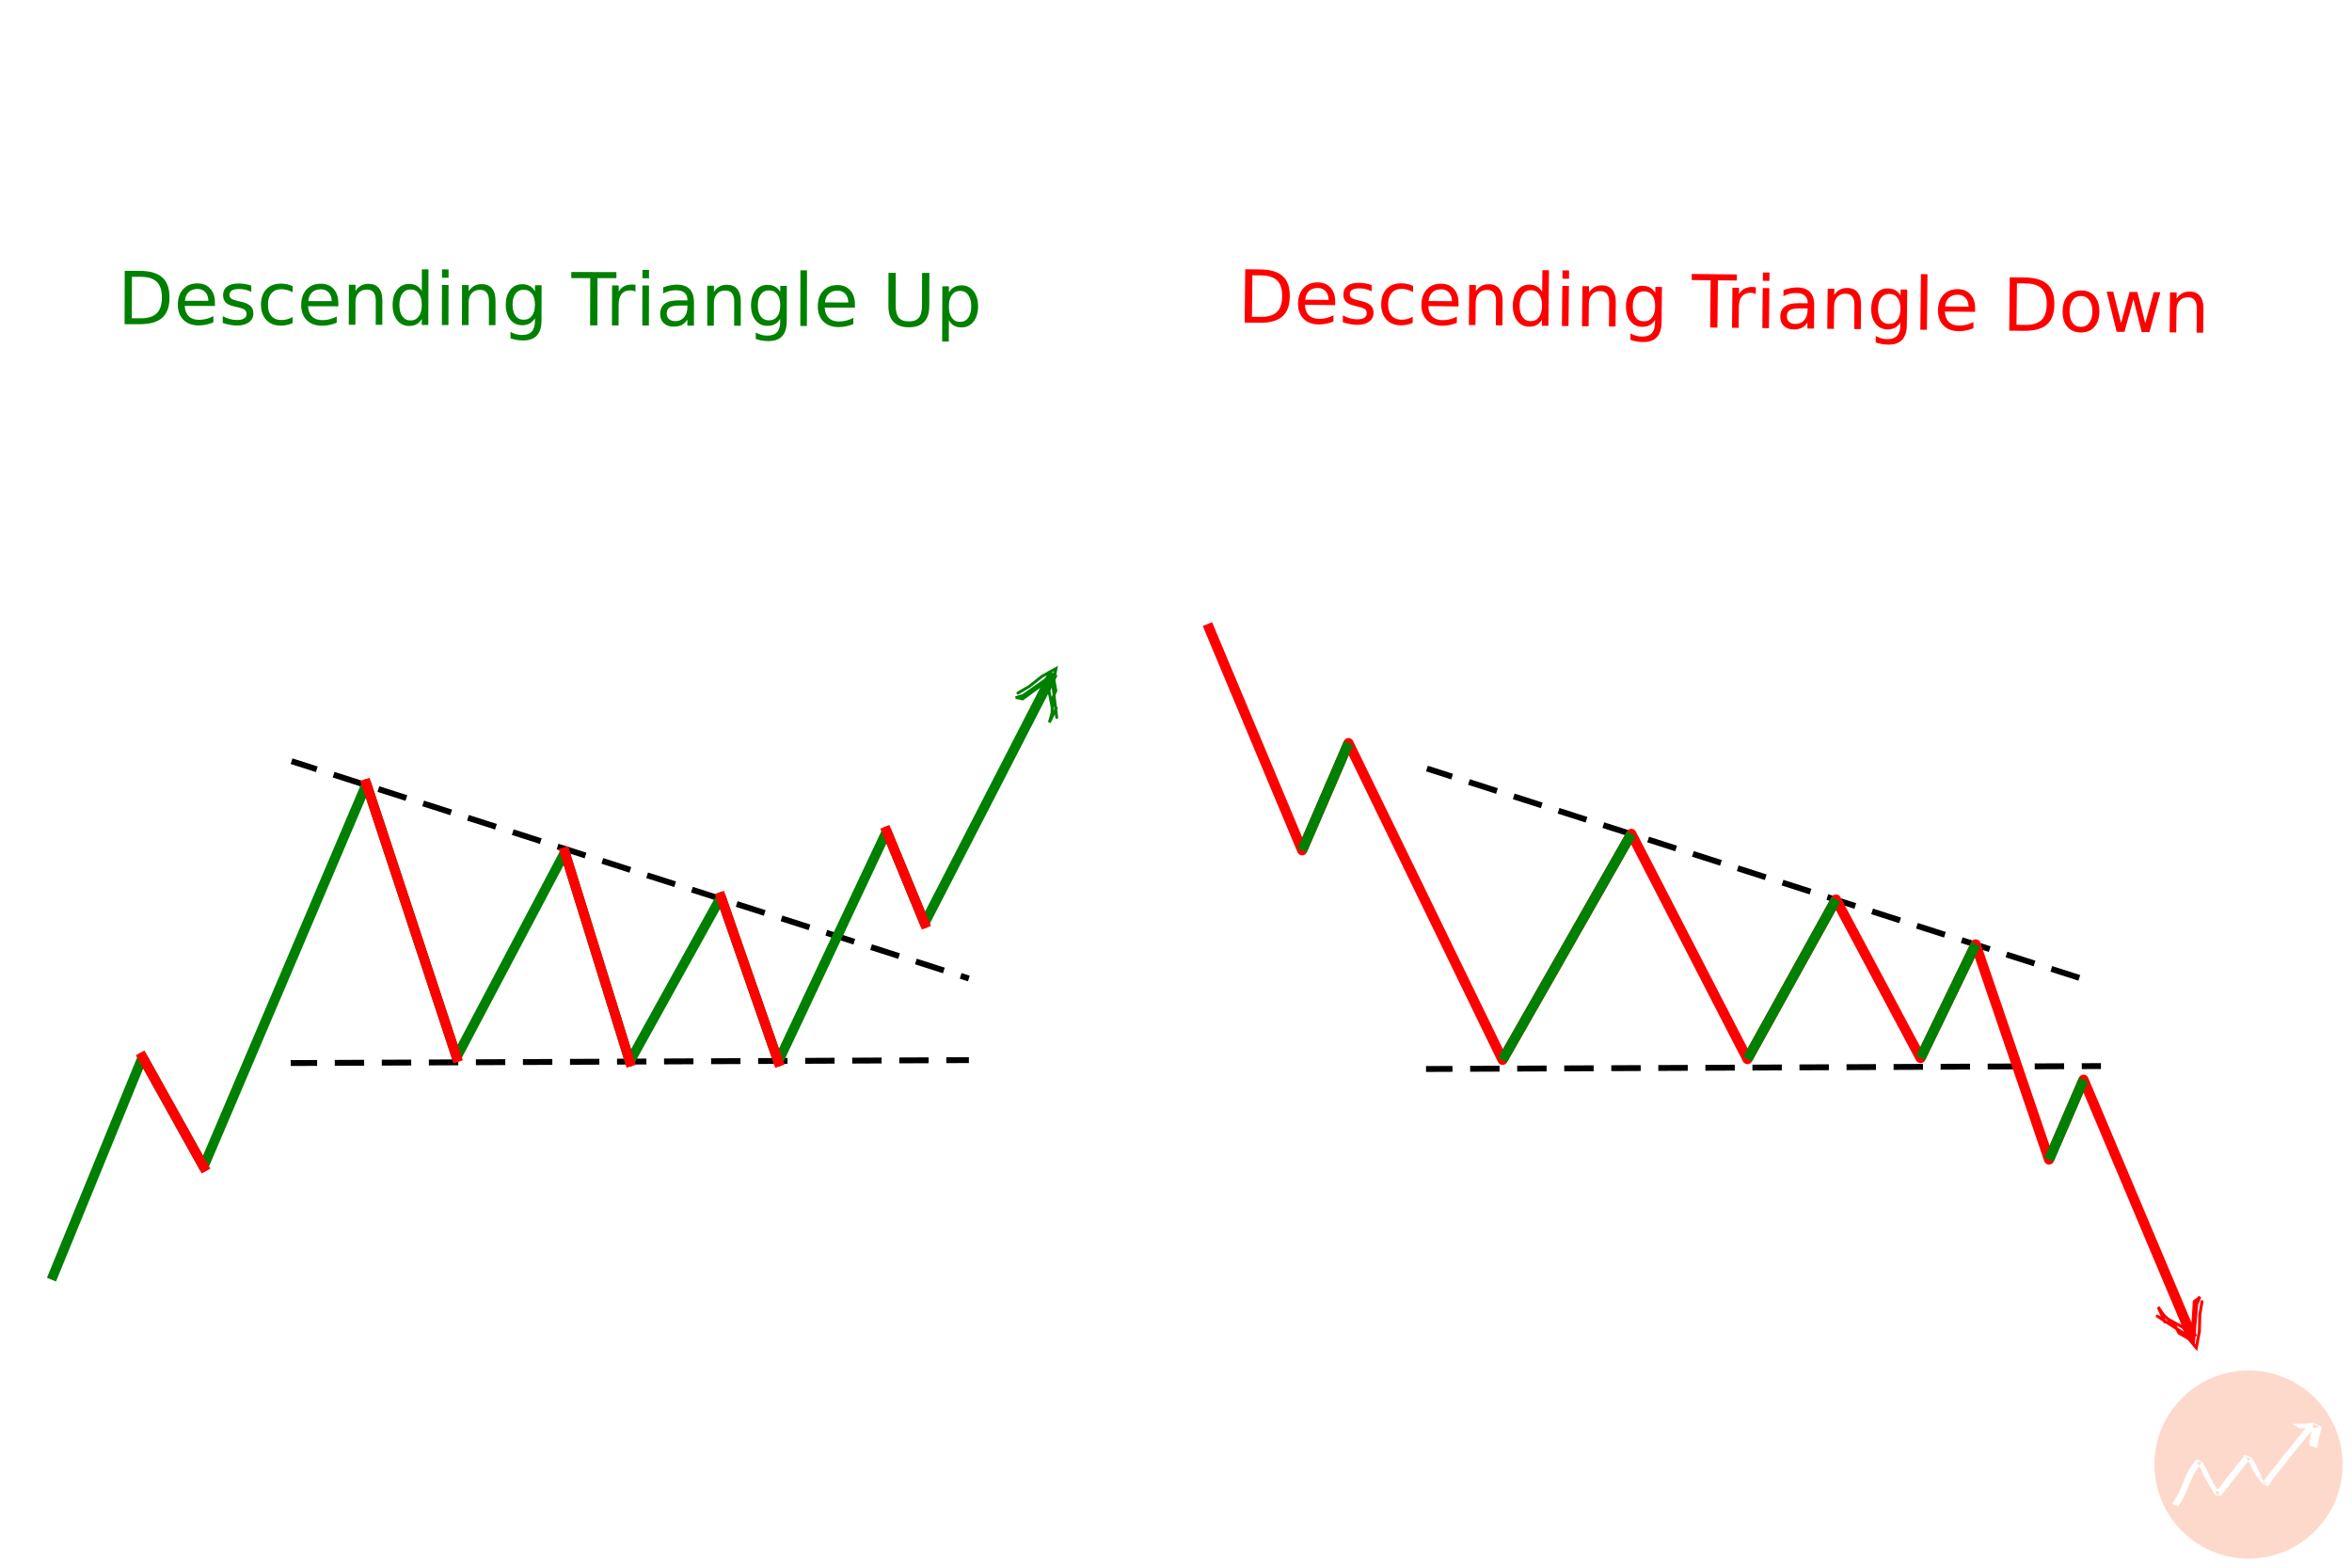
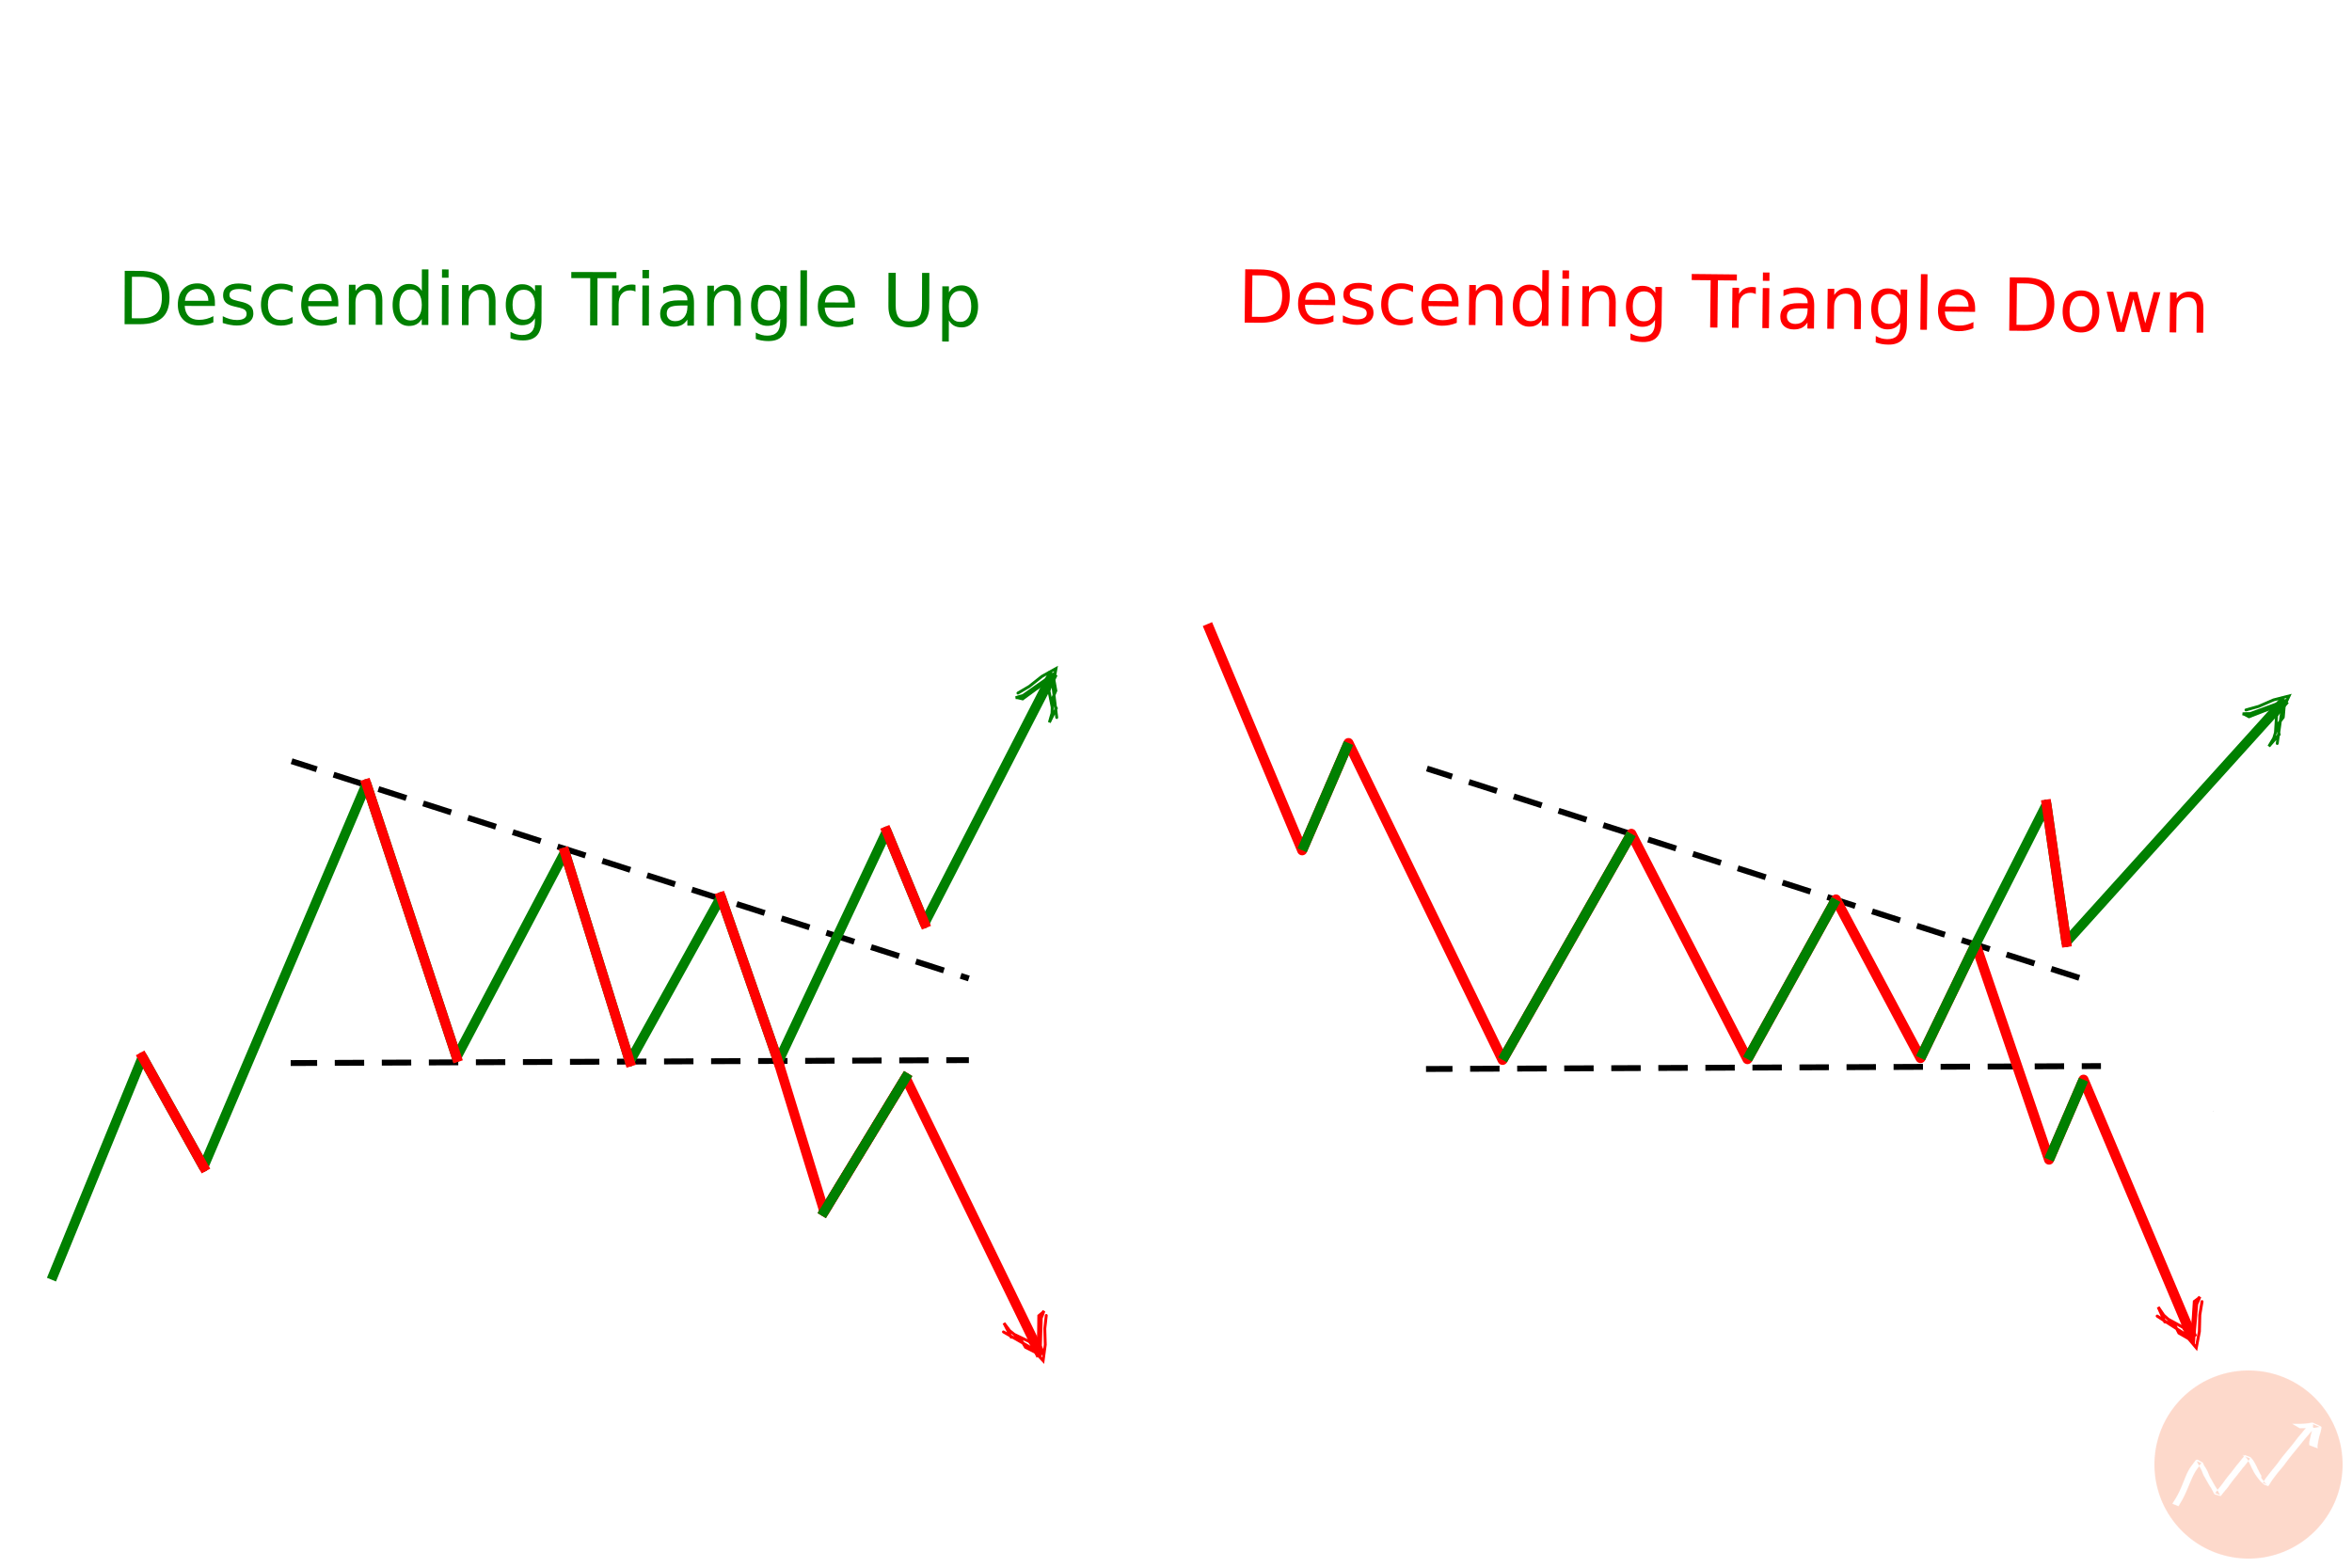
Descending Triangles
This chart pattern is formed when the support and resistance levels form a descending triangle shape.
The lower support level is the solid line, where the price is consistently held down, and the resistance is the dotted line, where the price struggles to break above.
Descending triangles typically indicate that sellers are in control and that prices will continue to fall. This chart pattern gives traders an indication that the current trend is likely to continue.
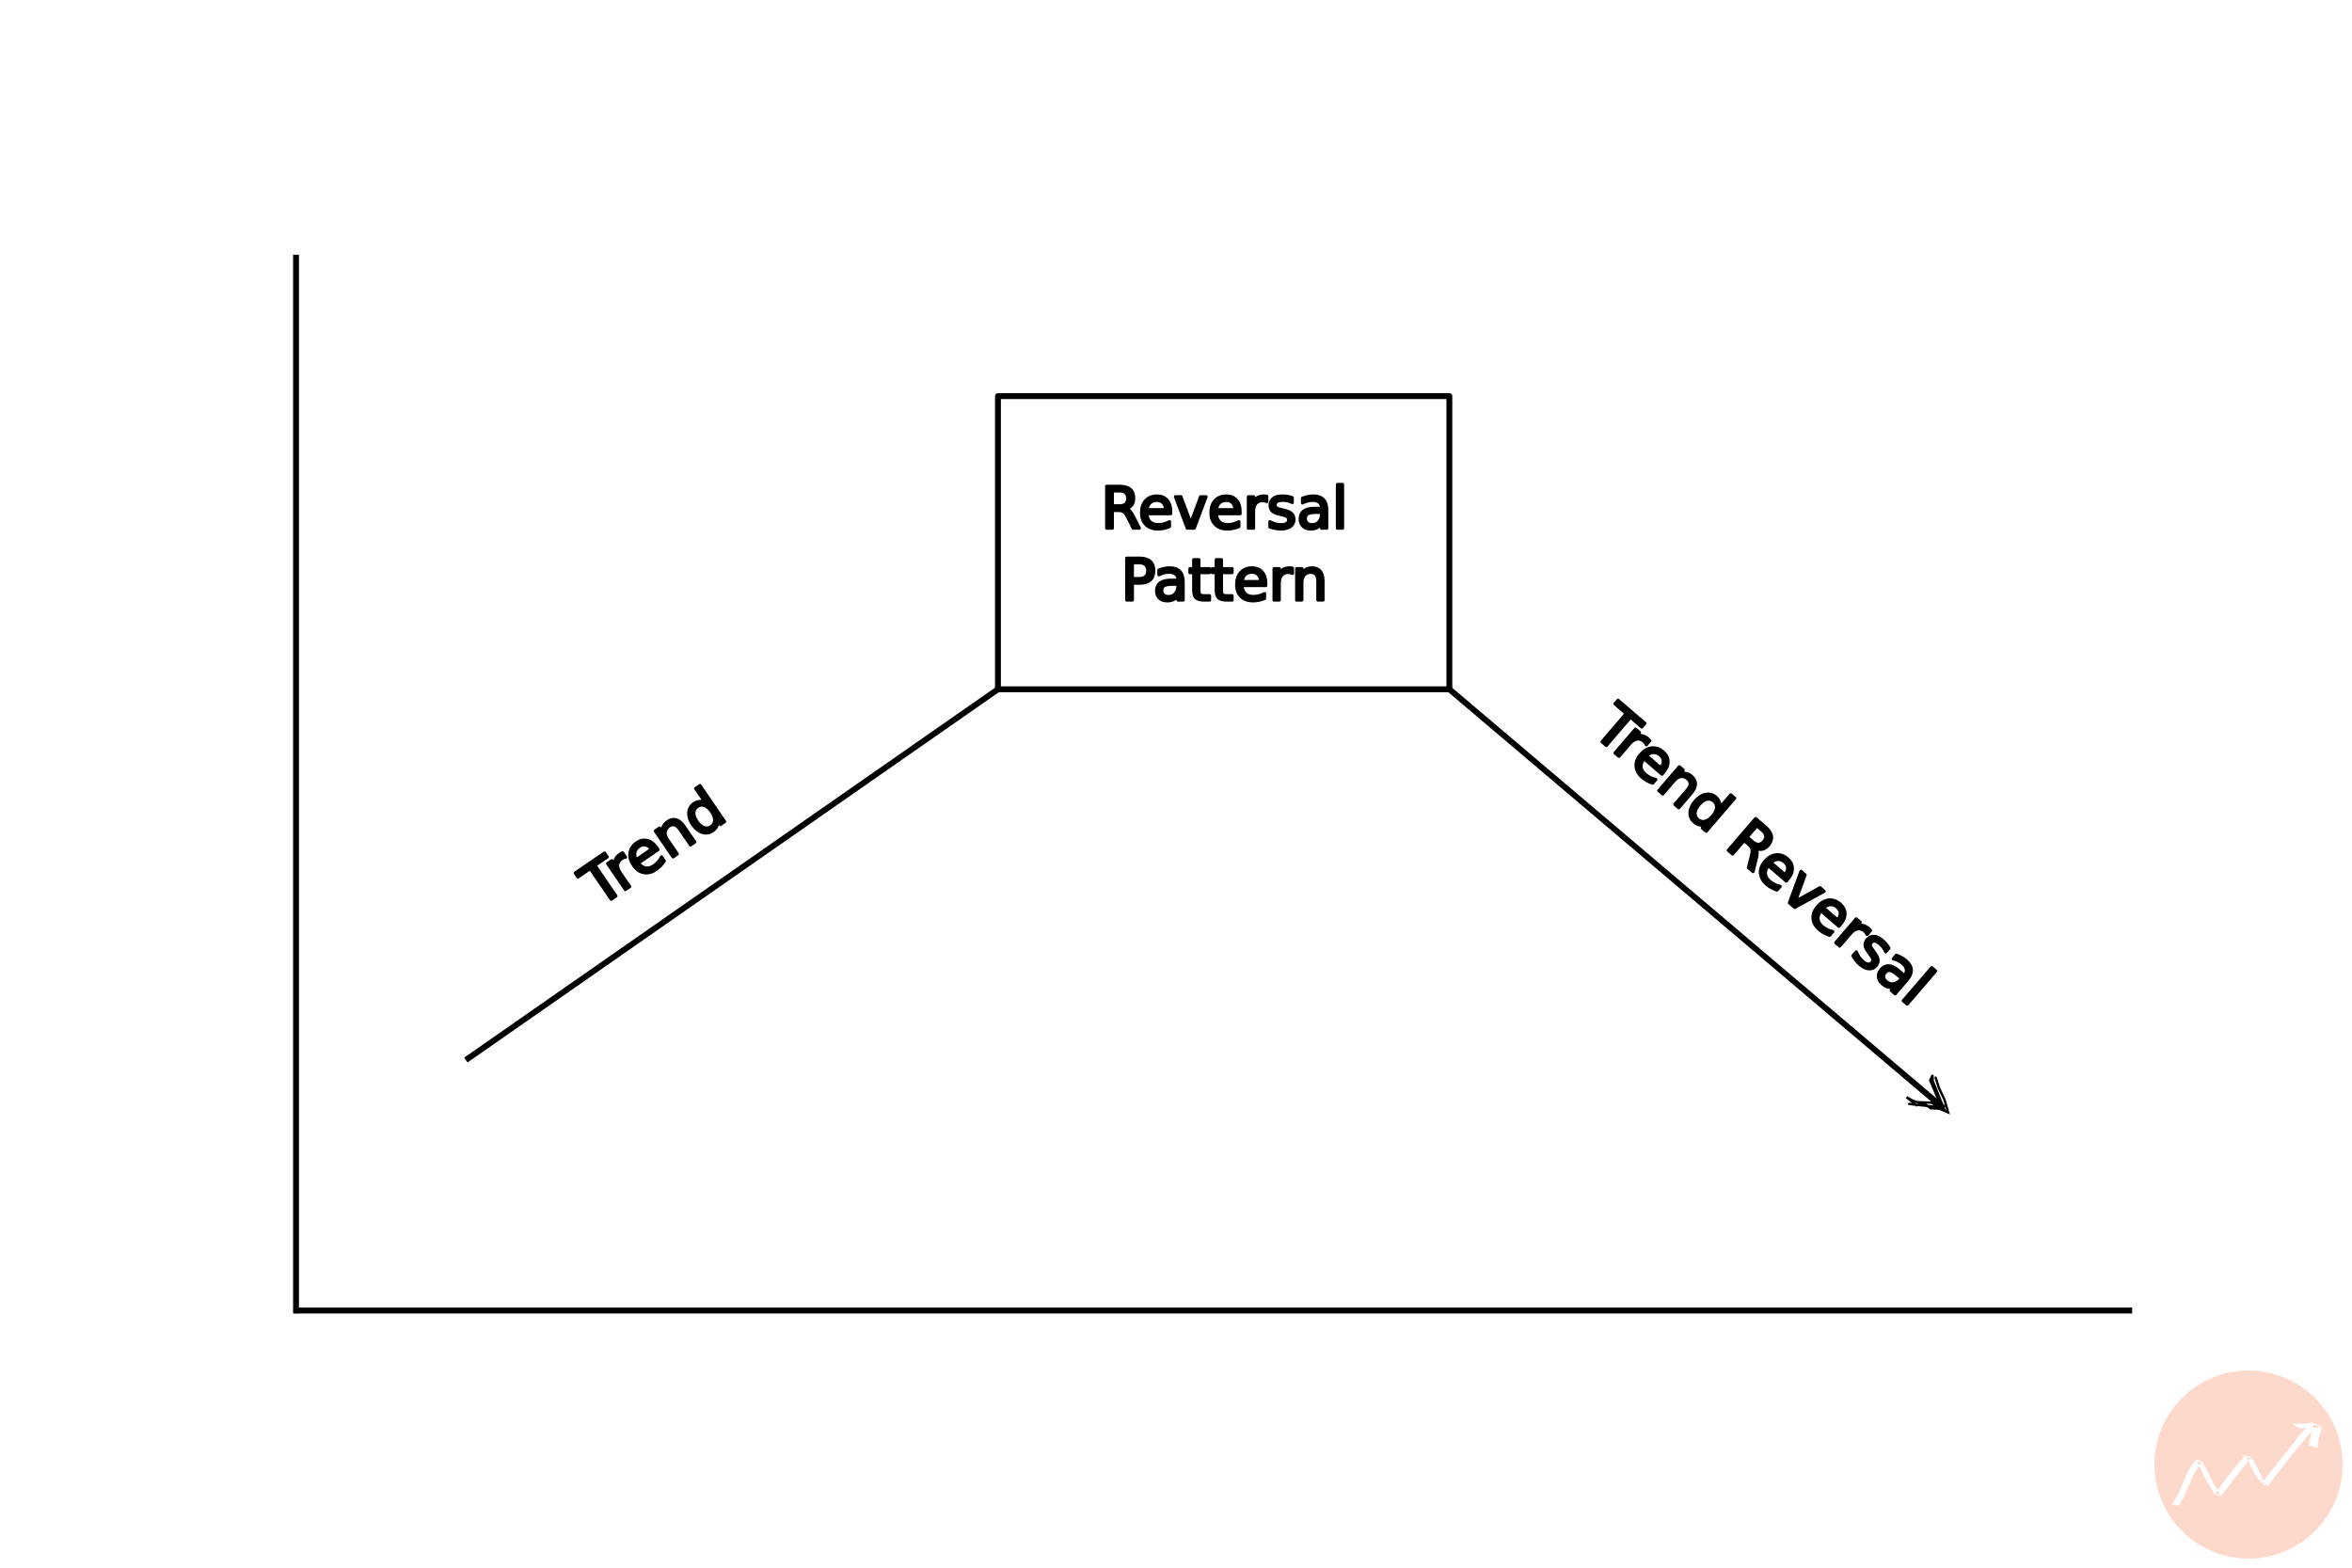
Reversal Chart Patterns
Reversal patterns occur when the price is changing direction and the trend is reversing.
Here are some examples of reversal chart patterns:
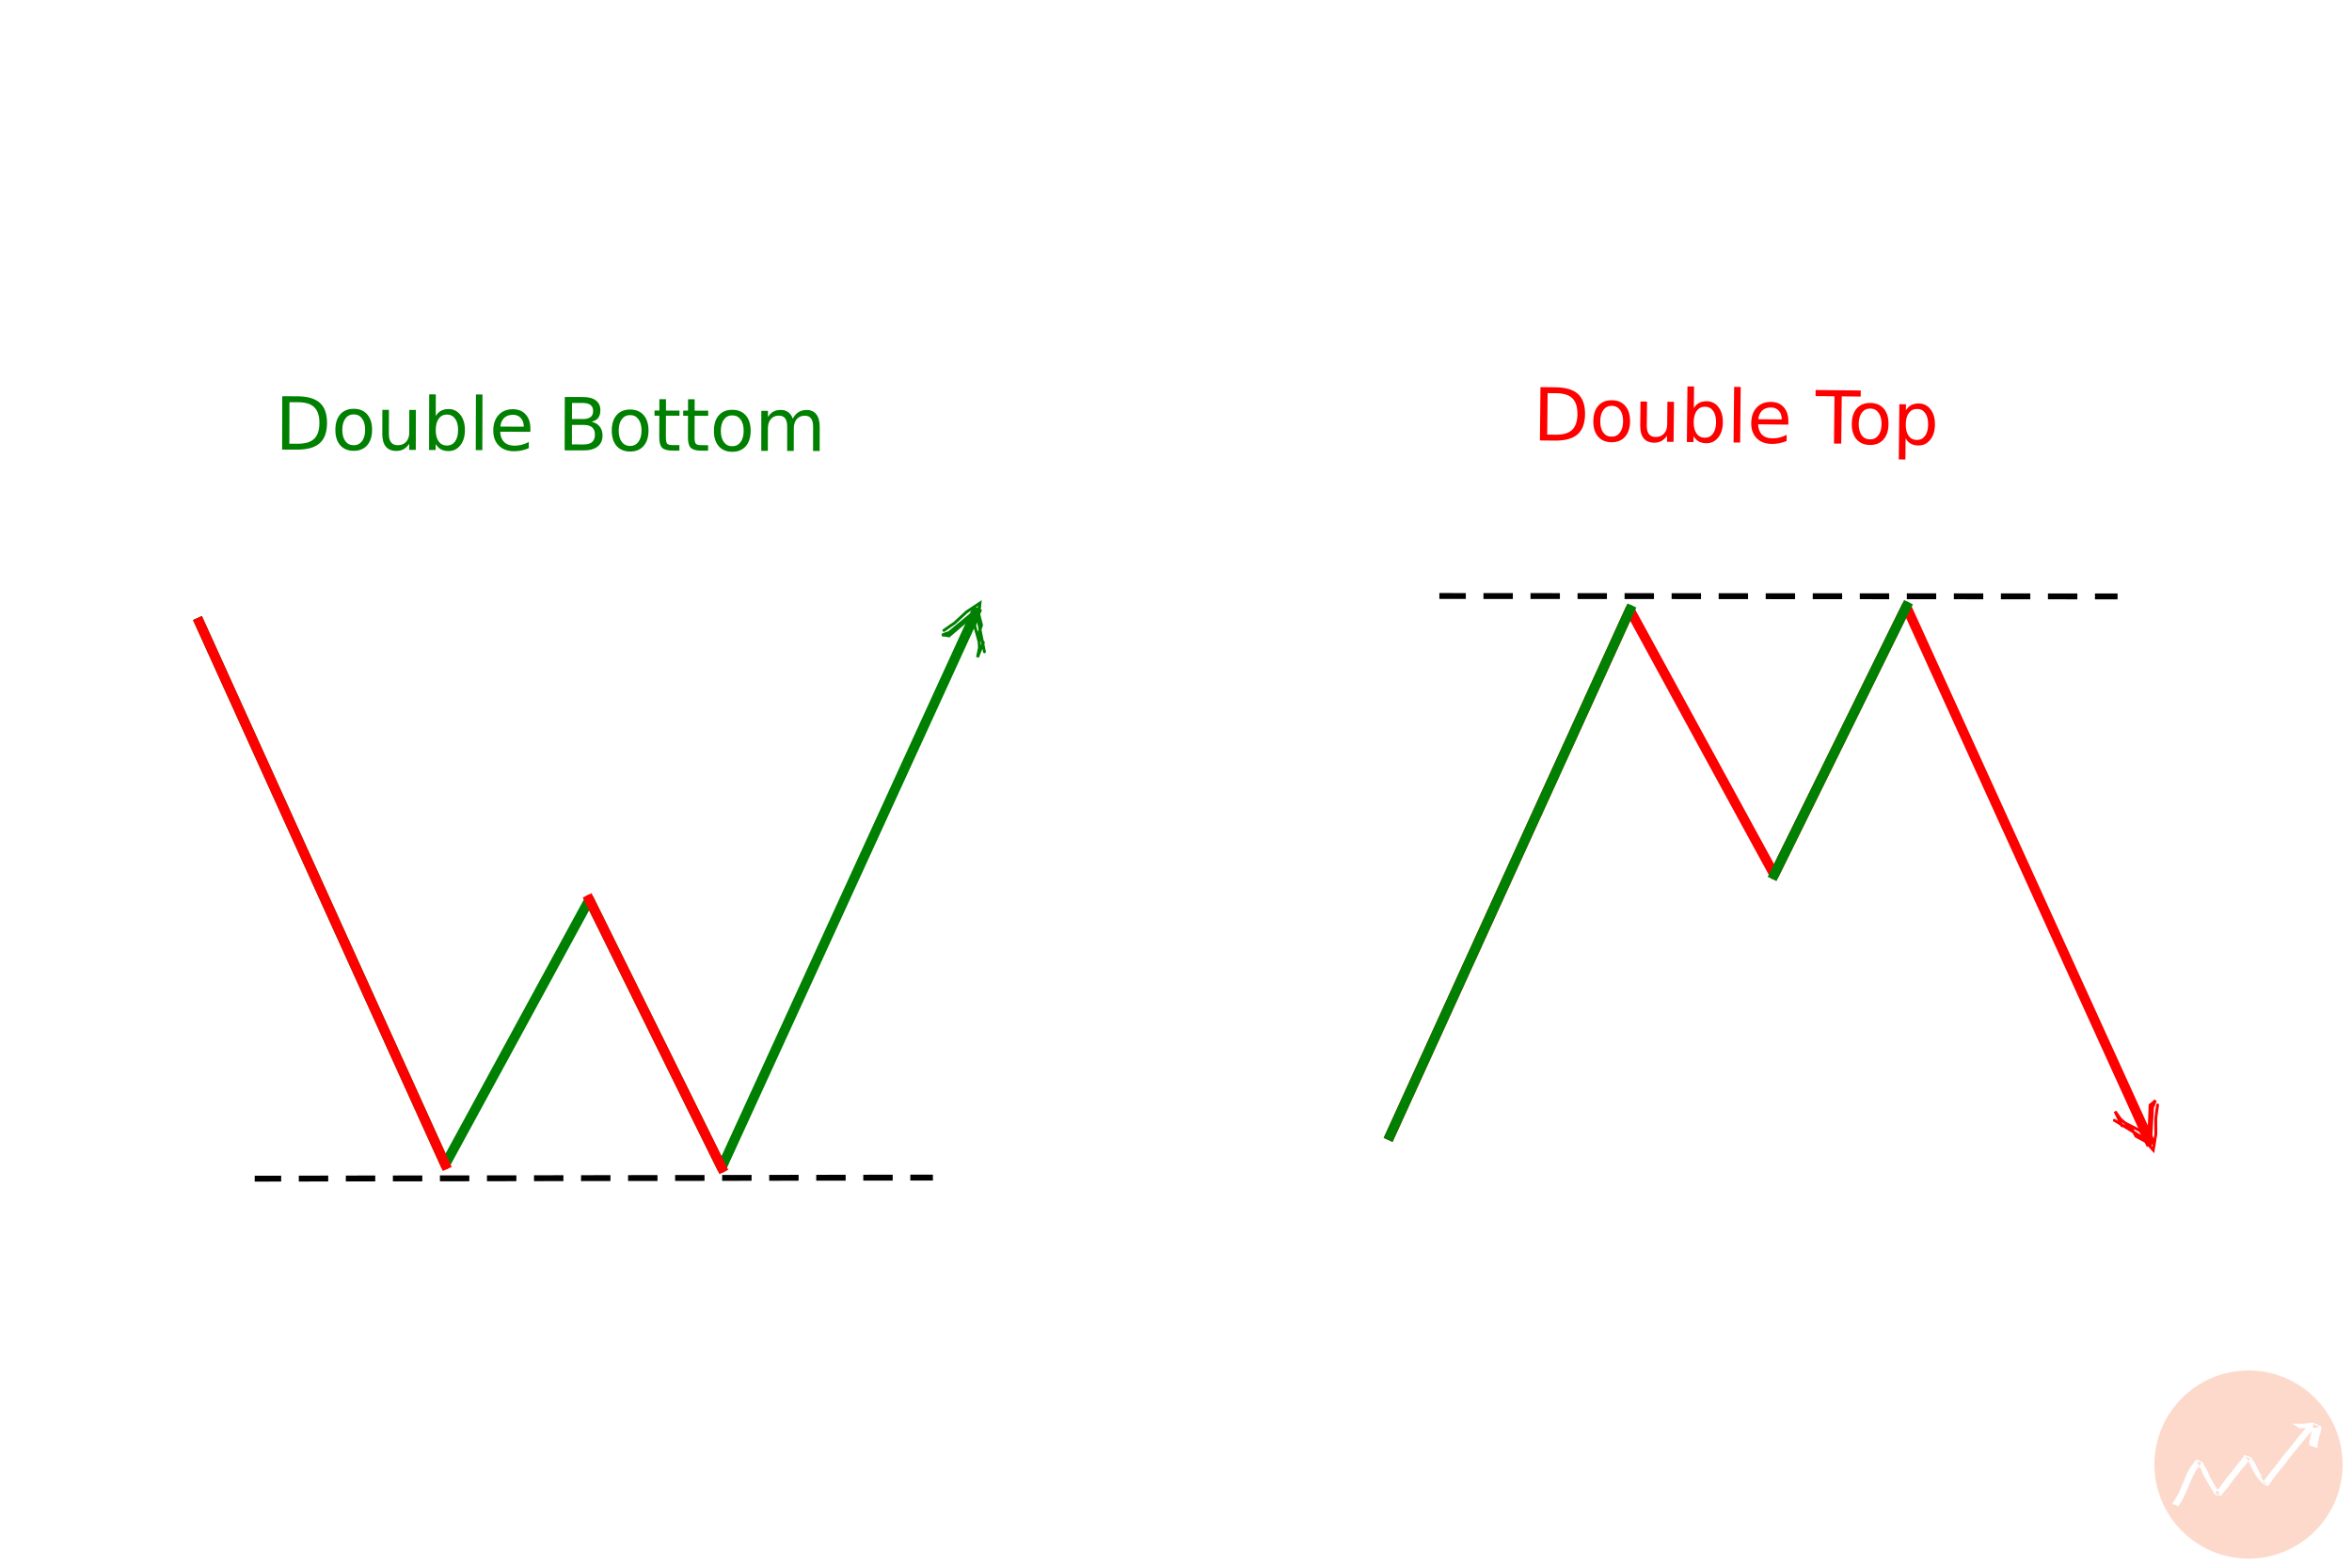
Double Bottom
A double bottom is a sign that an asset has hit a low point and is likely to begin an upward trend.
This pattern is formed when an asset reaches a low, then bounces back to the same low before beginning to rise again.
This indicates that buyers have entered the market, and the asset is likely to start a new uptrend in the near future.
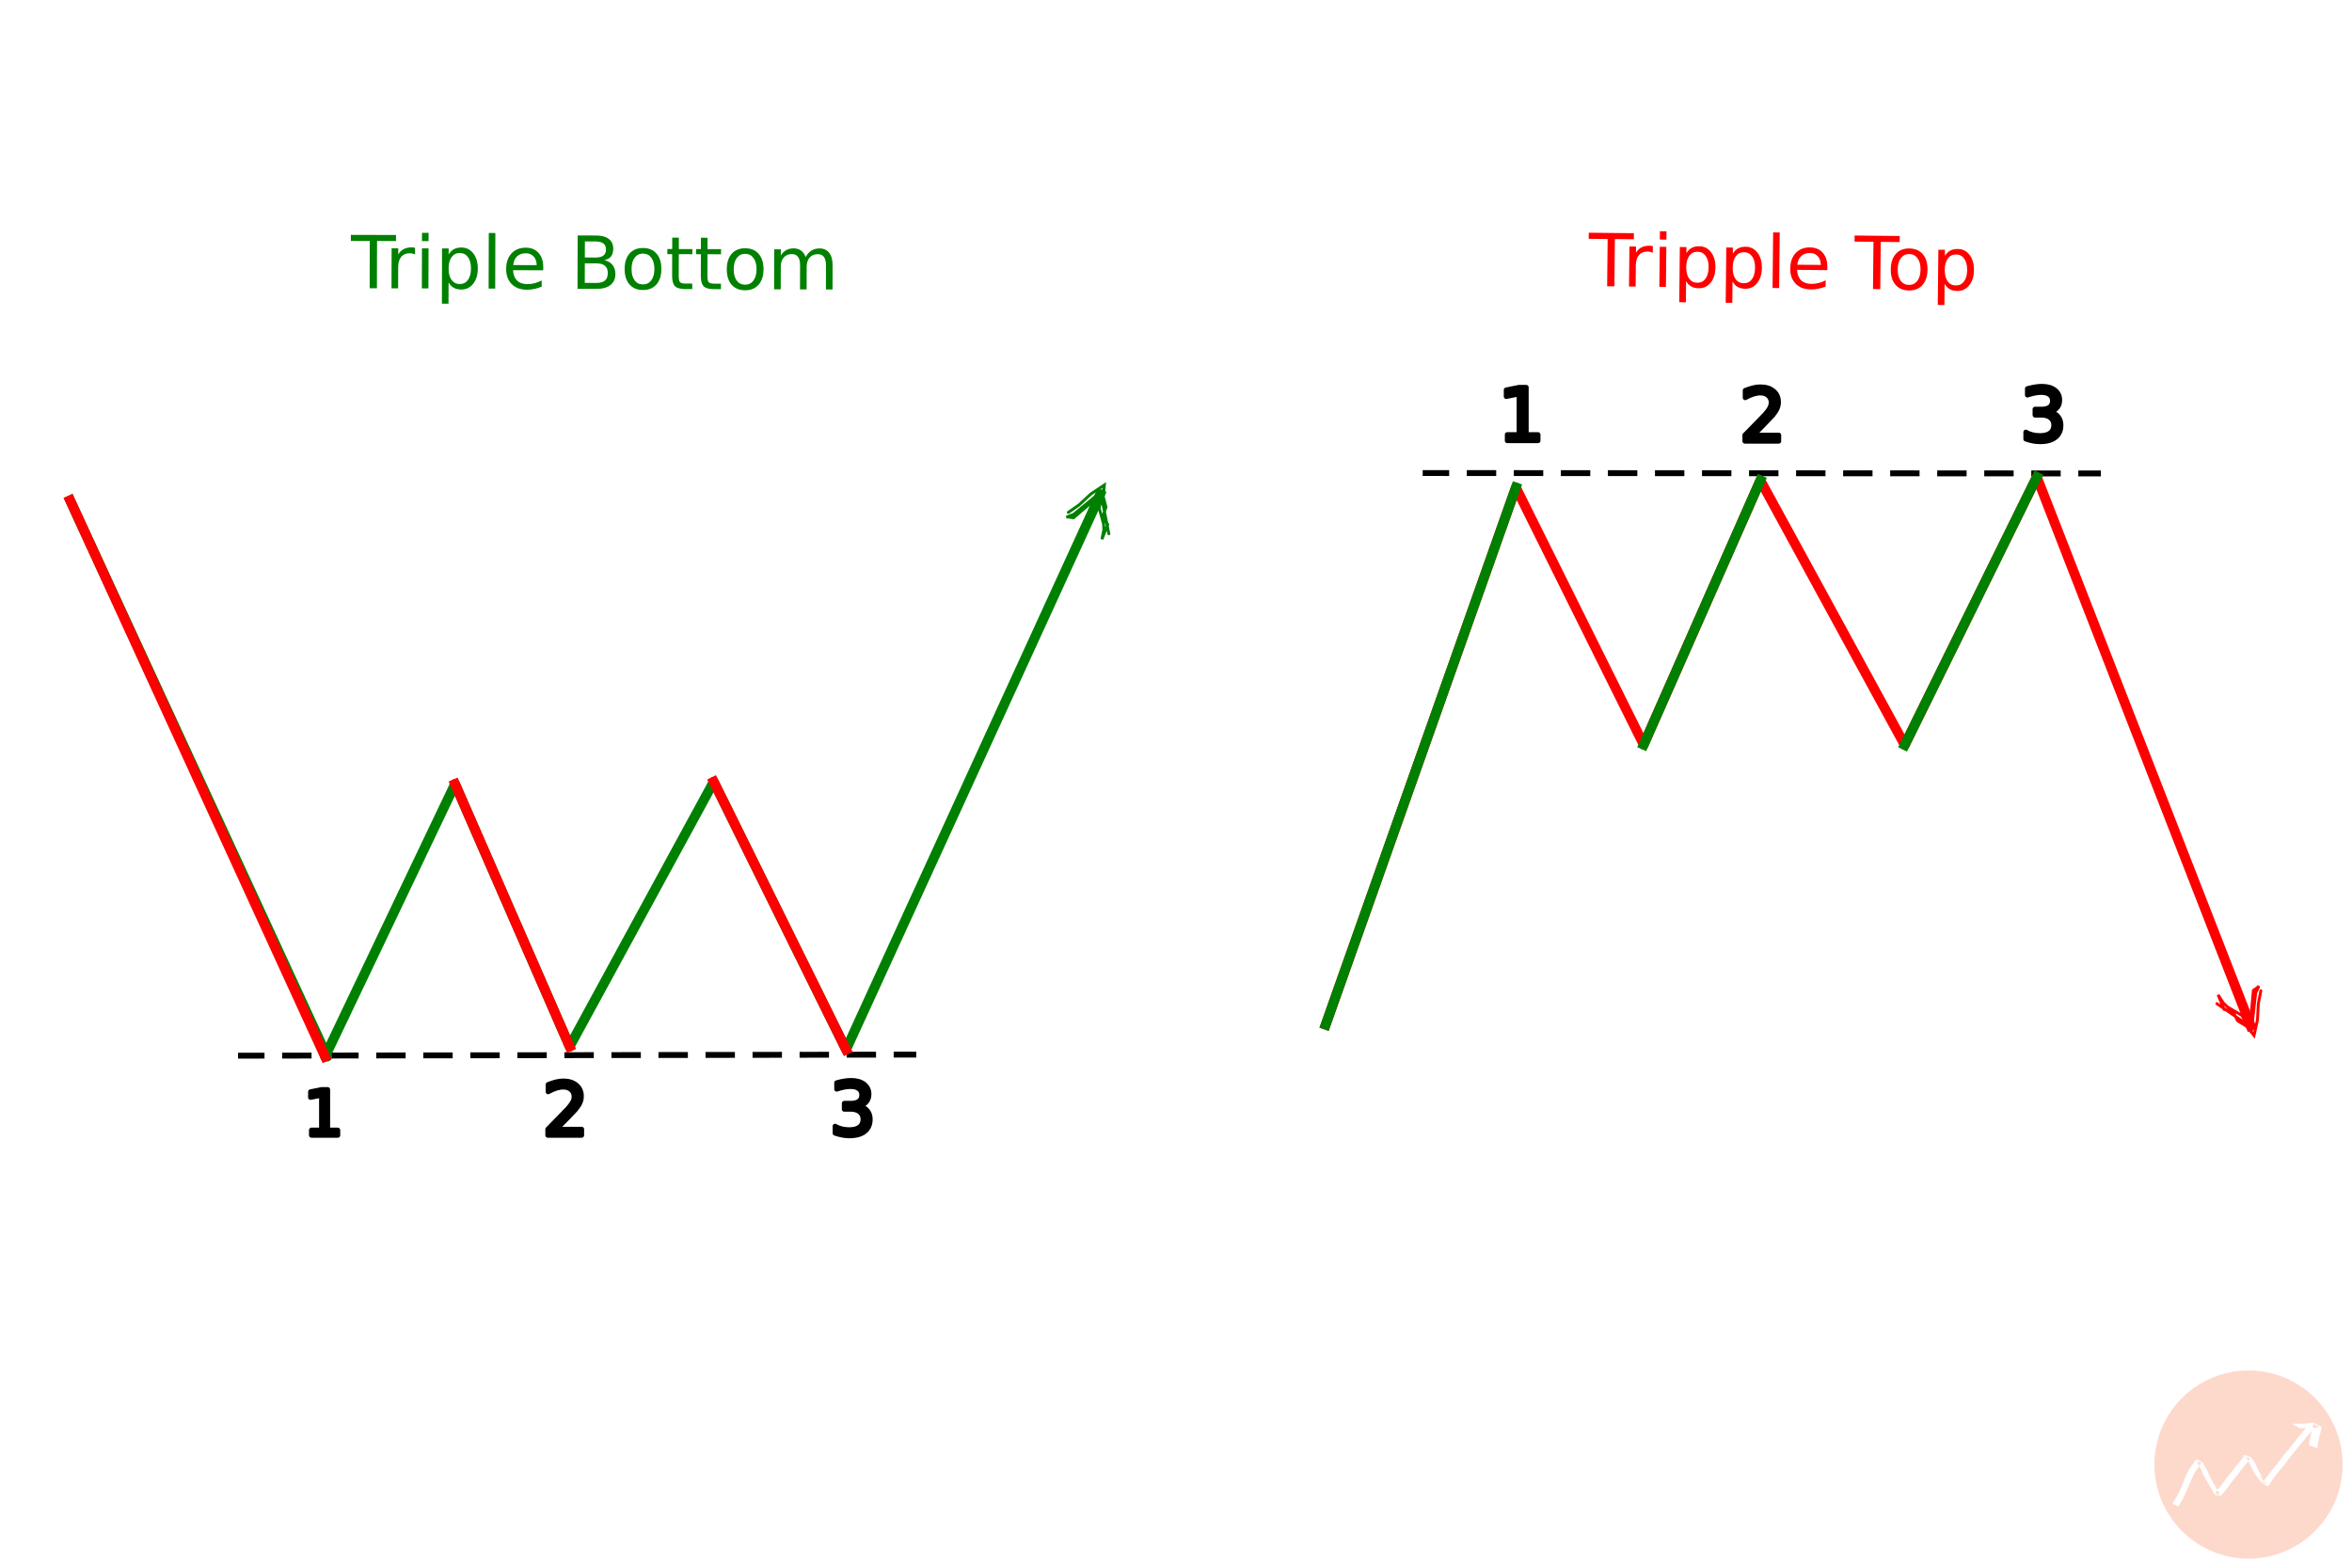
Triple Bottom
A triple bottom signals the reversal of a downtrend.
It is formed when there are three consecutive troughs at approximately the same price level.
This pattern indicates that the downtrend has ended and that the price of the asset is likely to start rising again.
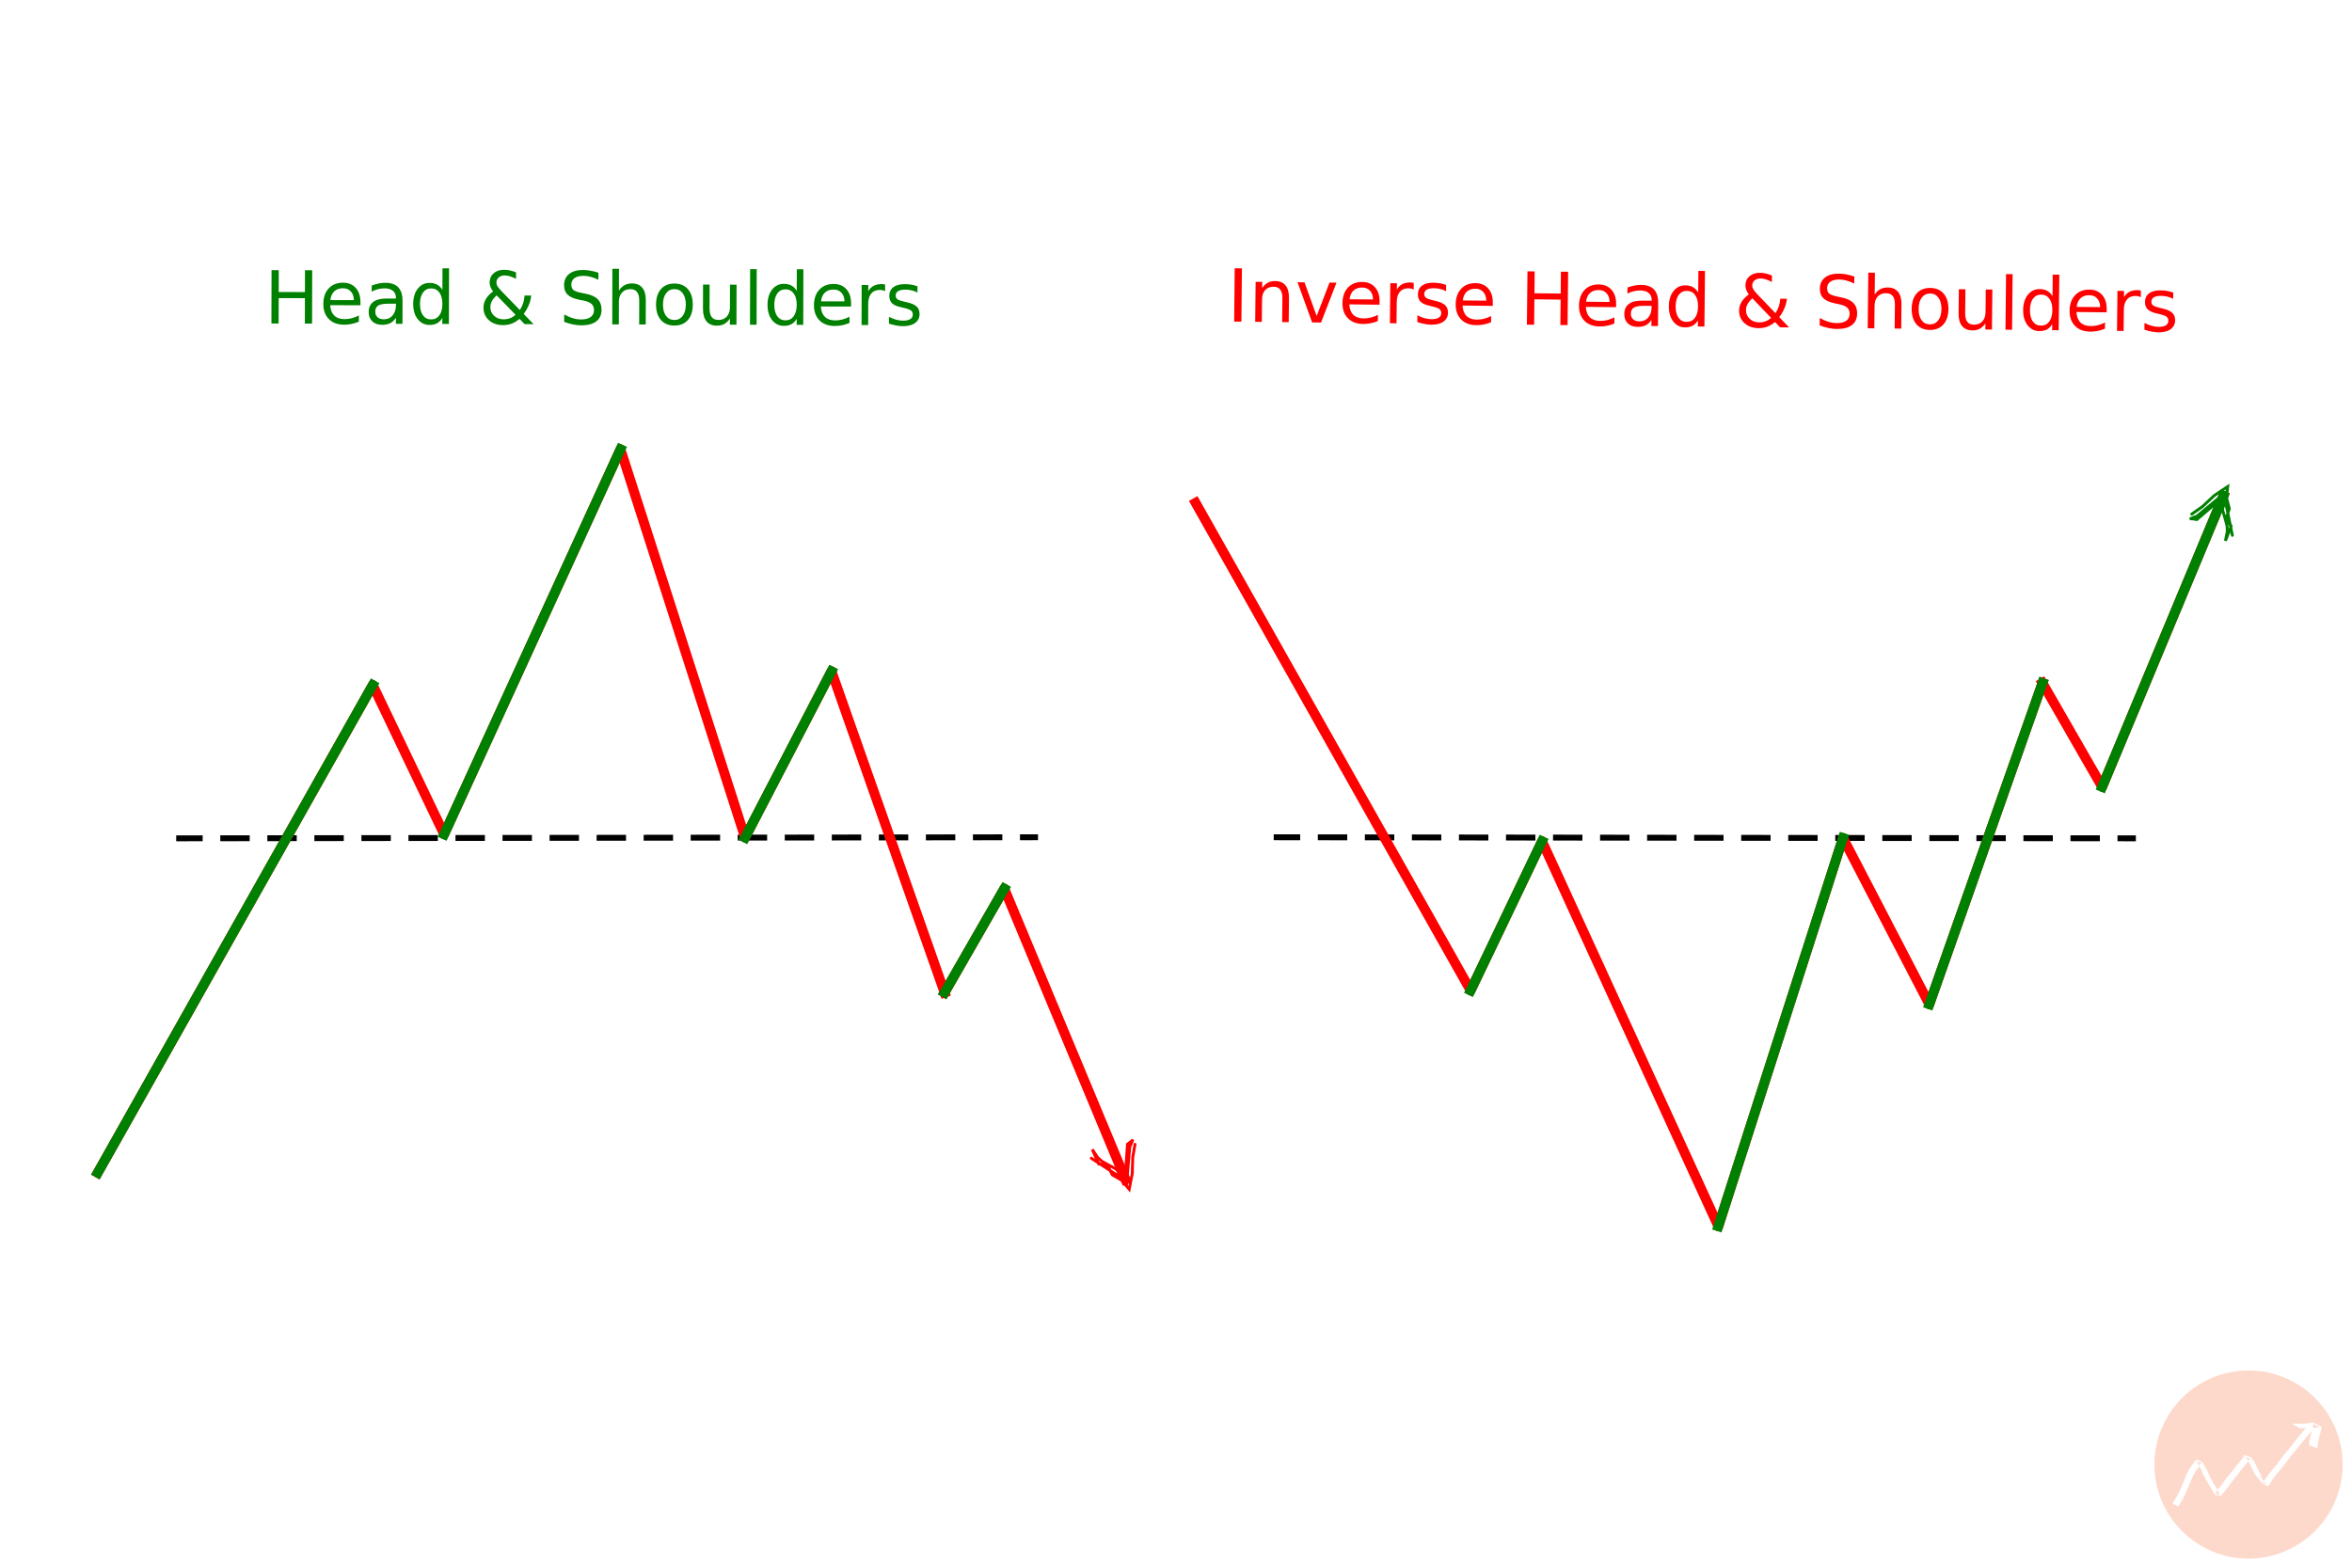
Head & Shoulders and Reverse Head & Shoulders Patterns
The head and shoulders is a bearish reversal chart pattern that is formed when price peaks, dips lower, peaks again and then dips lower again, forming the “head and shoulders.”
An inverse head and shoulders is a bullish reversal chart pattern and is formed when price dips, rises, dips and then rises again, forming the “inverse head and shoulders.”
These patterns can signal potential reversals in the price trend and can be used to signal potential buying or selling opportunities for traders.
Bilateral Chart Patterns
Bilateral patterns can occur in either direction and indicate a period of consolidation.
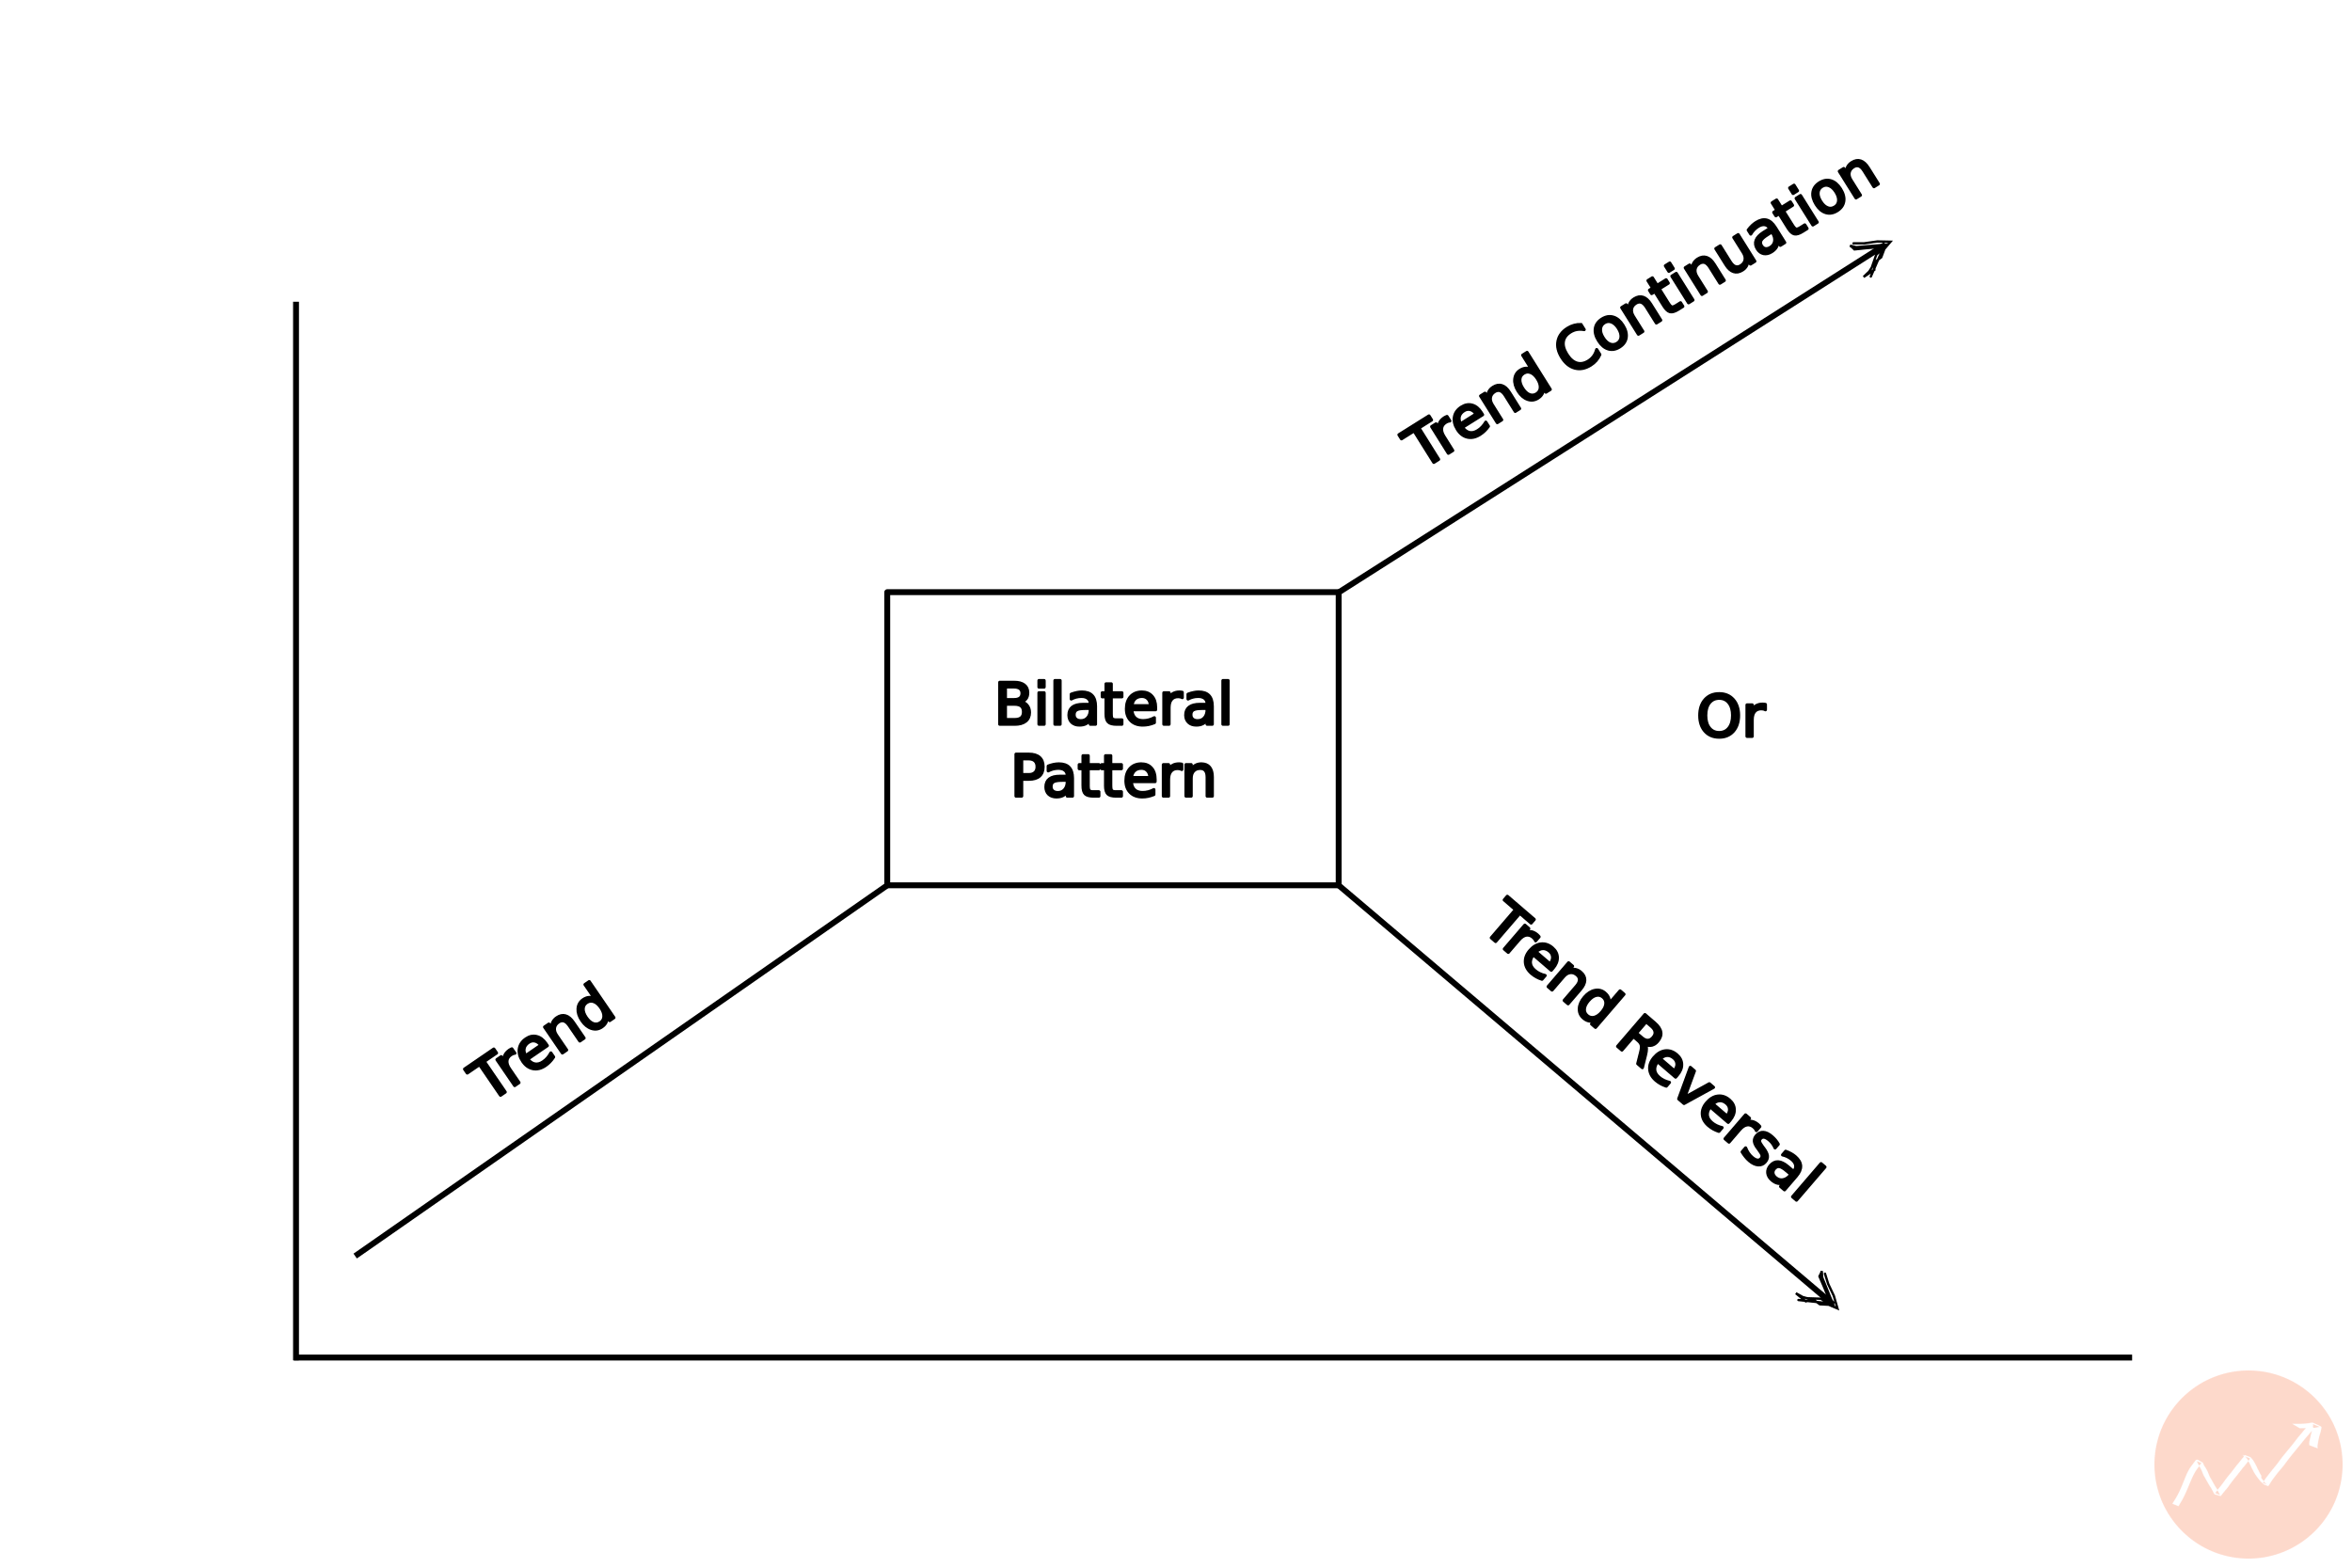
Here are some examples of bilateral chart patterns:
Ascending Triangles
Ascending triangles can be bilateral chart patterns because they are formed when two trend lines, an upward sloping one and a horizontal one, intersect.
This type of chart pattern is considered bilateral because it can resolve in either direction, either up or down.
Depending on the overall trend of the market, an ascending triangle can be seen as either a continuation pattern or a reversal pattern.
Descending Triangles
This pattern is considered bilateral because it can represent either a continuation or a reversal of the current trend.
When it forms during an uptrend, it is considered a bearish pattern as it indicates a potential reversal.
Conversely, when it forms during a downtrend, it is considered a bullish pattern as it suggests a potential continuation of the current trend.
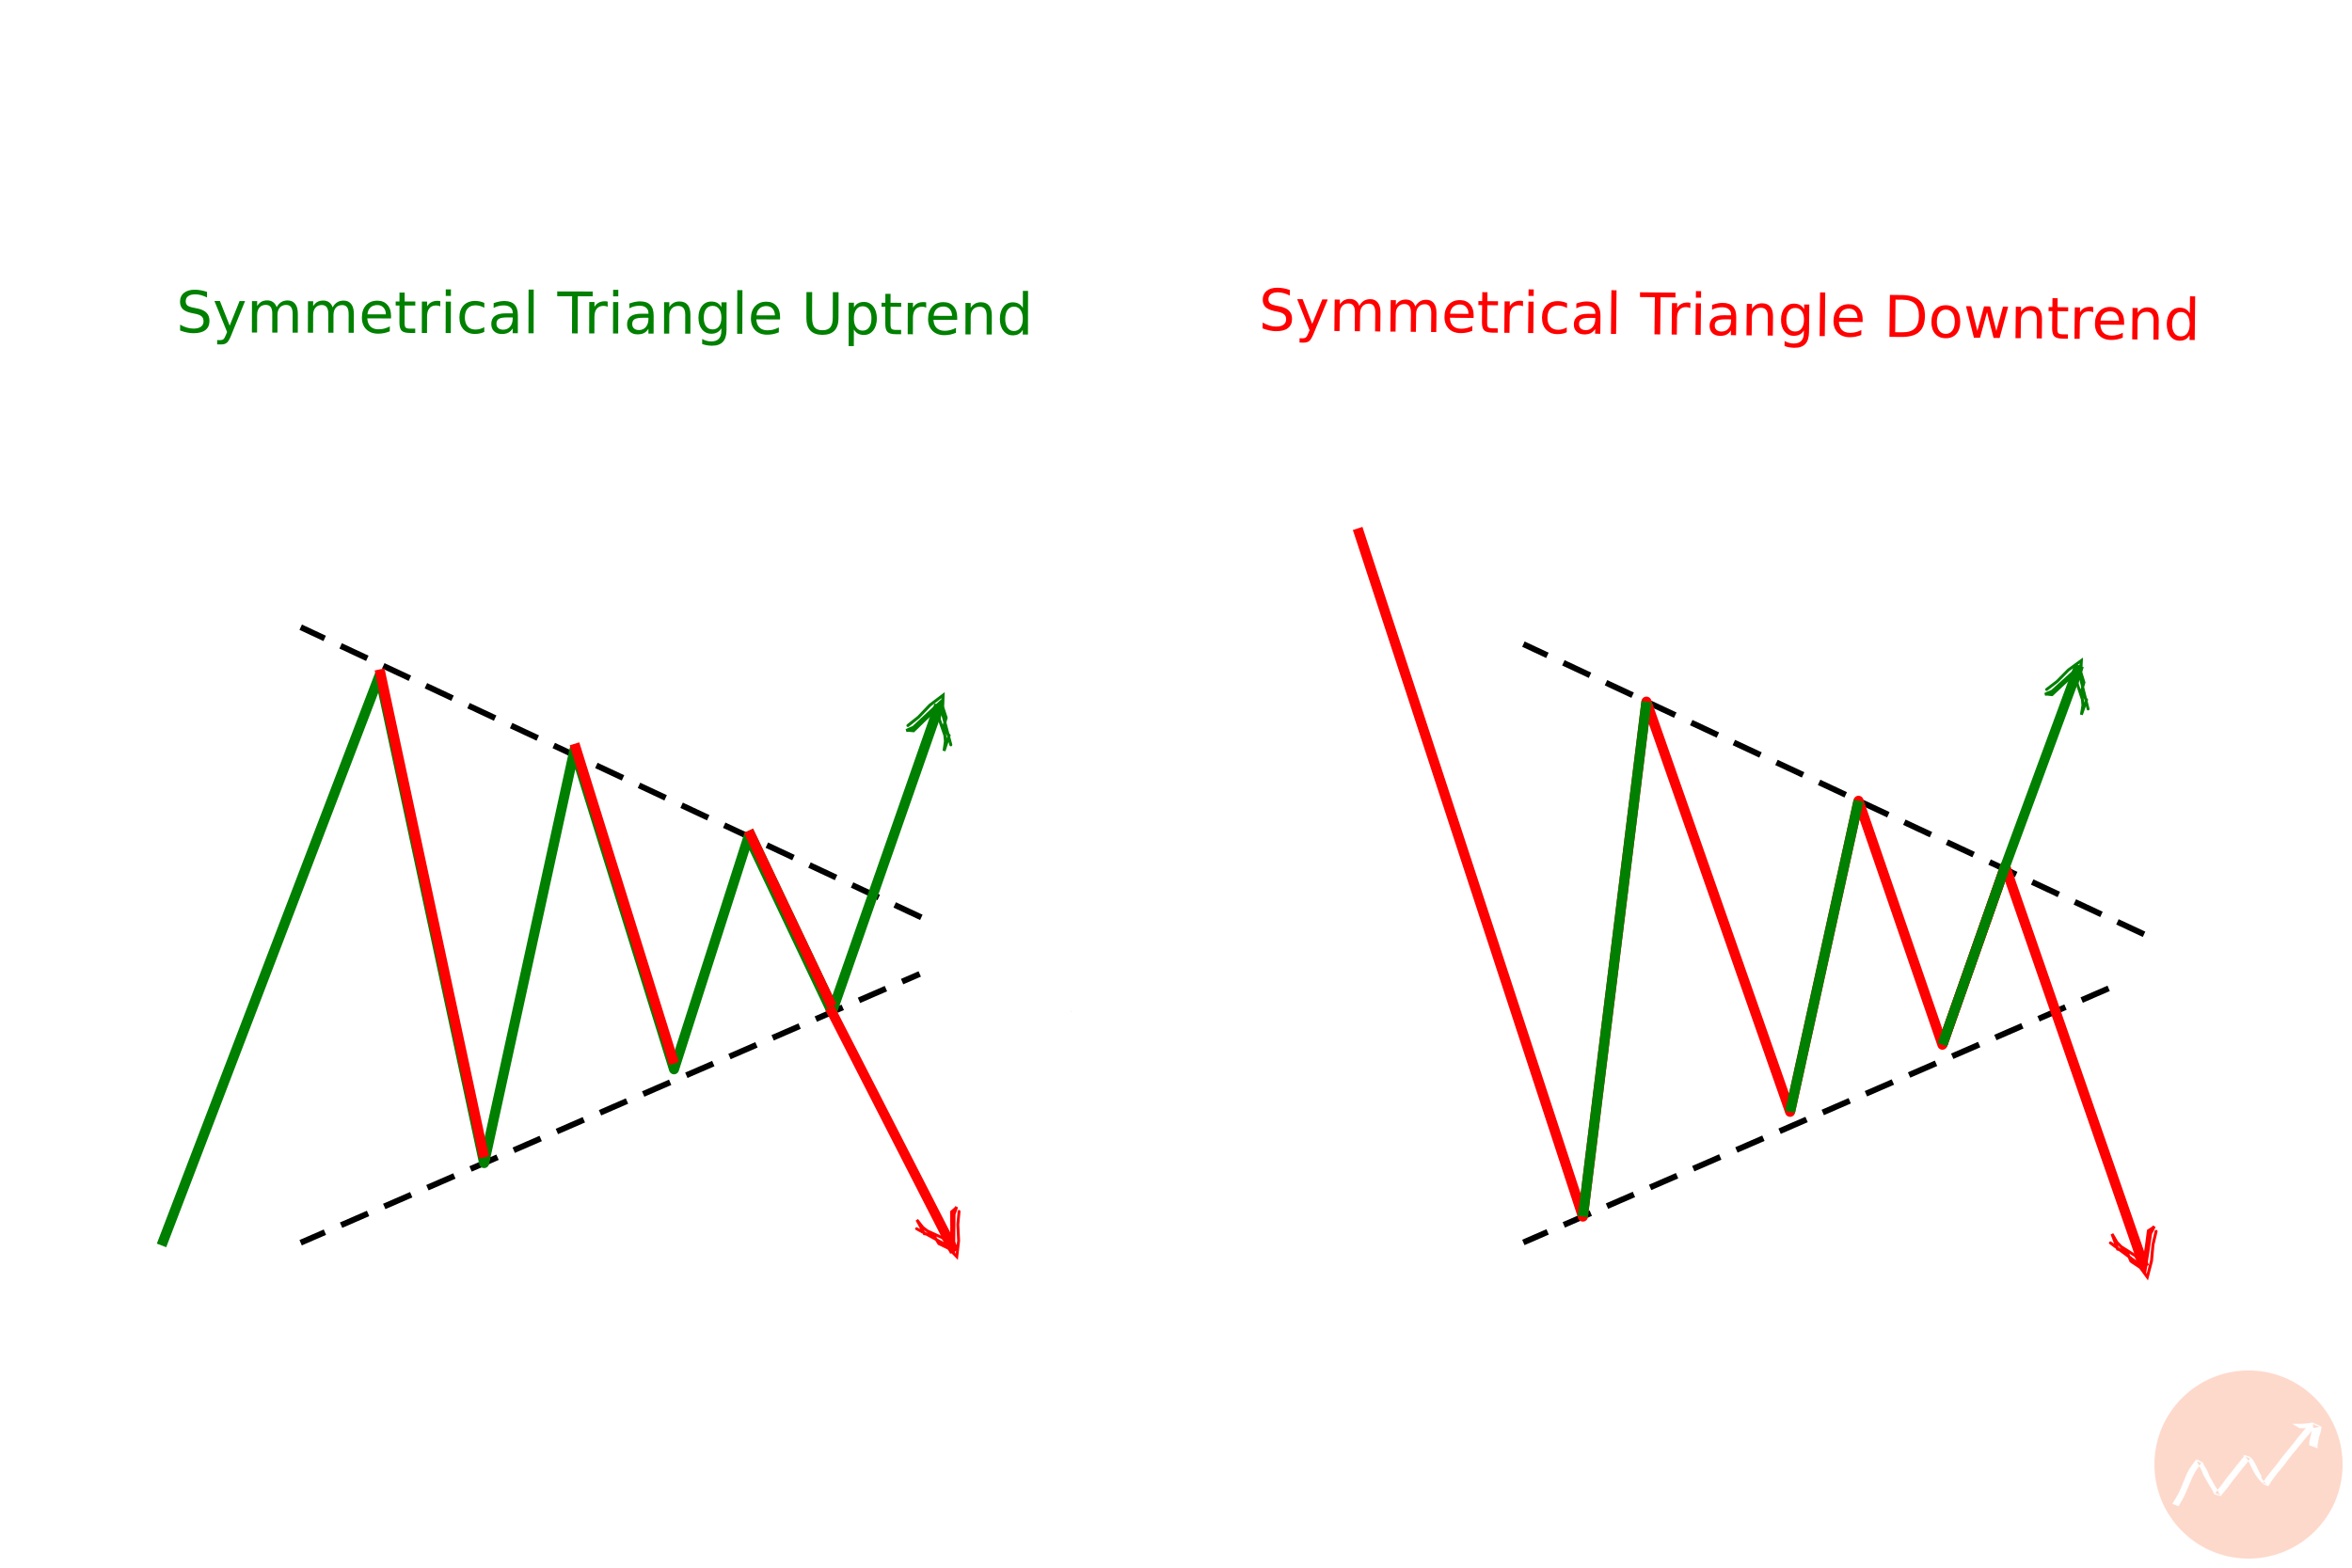
Symmetrical Triangles
Symmetrical triangles are considered bilateral chart patterns because they can form in both an upward and downward direction.
This is due to the fact that the same pattern is created regardless of the direction of the trend.
The symmetrical triangle is characterized by two converging trendlines that create converging highs and lows.
As the price moves up or down, the highs and lows of the trendlines become closer and closer together. This creates a triangle shape that can be either upward or downward in direction.
Symmetrical triangles can be used to identify potential reversal points or to confirm a trend.
Summary
In technical analysis, chart patterns are divided into three main groups: continuation, reversal, and bilateral patterns.
It is important to consider the overall trend of the price, the volume of trading, and the time frame when attempting to identify these patterns.
Low volume can indicate that the pattern is less likely to continue, and assessing the right time frame is necessary for accurate pattern recognition.